A practical example of hedging gas swing contracts
A practice example
KYOS publication on hedging a gas contract
Hedging gas swing contracts
 This report contains a worked example of gas trading with gas swing contracts. It shows how a trader could optimize his trading decisions in the gas spot market, while delta hedging the exposures in the forward market: the spot trades maximize the optionality of the contract, while the forward hedges limit the risk.
Download the report
Click here the report or read the main text here:
1 Introduction
1.1 Objectives of the study
This report describes a so-called backtest, performed on two similar TTF swing contracts delivering over the calendar years 2014 and 2015. The analysis assumes that a trader has a gas swing contract with daily flexibility and quarter-ahead indexation. The backtest is a worked example of how a trader could optimize his trading decisions in the gas spot market, while delta hedging the exposures in the forward market: the spot trades maximize the optionality of the contract, while the forward hedges limit the risk.
All these decisions, in spot and forward gas markets, are supported by the KySwing model, a proprietary software product, embedded in the KYOS Analytical Platform. A large number of market players already use this model to value gas swing contracts and to optimize trading decisions. More information about the software is available on the KYOS website www.kyos.com.
1.2 Summary of the gas swing contracts
We performed the analysis over two TTF gas swing contracts. One of them delivers in the calendar year 2015, and the other one in 2014. The two contracts are similar:
- Their daily contract quantity is between 0 and 2,400 MWh.
- Their annual contract quantity is 216,000 MWh (to be fulfilled 100%).
- The contract price is quarter-ahead indexed, so equals the average Q+1 price in the preceding quarter.
1.3 Principles of the spot trading strategy
The annual quantity of 216,000 MWh allows a trader to take the maximum volume of gas (2,400 MWh) on exactly 90 days. The value of the contract is maximized when these volumes are taken on the days where the gas market prices have the largest (positive) spread to the contract price.
At the start of a quarter, the contract price for that quarter is known. So, when the gas spot prices move up relative to the contract price, it becomes increasingly attractive to take gas from the contract. However, taking gas now, generally reduces the optionality of taking gas in future periods. Likewise, when the spot price moves down relative to the contract price, it may be unattractive to take gas, but a trader should make sure to take gas on exactly 90 days in order to meet the annual contract quantity.
1.4 Principles of the forward hedging strategy
During a quarter, when the contract price is fixed, the owner of the contract will benefit from increasing market prices; there is a positive exposure to market prices. This exposure can be hedged by selling gas forward in the remaining period in the quarter. The so-called delta hedges are the optimal forward trading positions at a specific point in time which (largely) neutralize the risks from changes in forward market prices.
The exposure to market price changes in future quarters of the year is rather small. Exposure are mainly built up for the next quarter-ahead, as a result of the quarter-ahead price settlements, which gradually fix the contract price. To summarize, for a quarter-ahead indexed contract:
- Delta hedges are rather small: no or limited forward hedges are needed in the Q+2 period or later
- In the Q+1 period, delta hedges are negative and tend to grow when the end of the quarter approaches
- Current quarter (Q+0 period), delta hedges are negative and tend to decline (in MWh) because the remaining delivery period becomes shorter
- Both the current quarter (Q+0) and the next quarter (Q+1), delta hedges can go up and down, mainly moving with the spread between the expected market price and the expected contract price
2 How much money could have been made?
The main purpose of the backtest is to find out how a trader could have made money from the moment of contract signature to the last delivery day. We assume that a trader values the contracts just before the first delivery day. Because the contracts are quarter-ahead indexed, the contract prices in the first three months are already known by then.
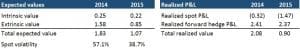
The estimated contract value is 1.83 €/MWh for the 2014 contract and 1.07 €/MWh for the 2015 contract. This value is composed of intrinsic value (using a monthly forward curve) and extrinsic value. The extrinsic value is obtained from optimizing the daily spot trades over a large number of Monte Carlo simulations, using the Least-Squares Monte Carlo approach. The extrinsic value, and hence also the total value, is lower for the 2015 contract, due to the drop in spot price volatility from 57.1 to 38.7%.
Active trading
A trader must actively trade in the gas market to realize the full optionality. For this purpose, he should engage in two types of activities:
- At the end of each day, decide which volume to take from the contract the following day (day-ahead). If it is optimal to take any gas, it will almost certainly be optimal to take the maximum volume of 2,400 MWh. To support these decisions, the KySwing model is run every (trading) day and shows at what price levels it is optimal to take contract gas.
- After having set up forward hedges at the contract start, periodically the trader should adjust the forward hedges. For simplicity, we assume the delta hedges are adjusted at the end of each month.
At the end of the contract period, a trader will have realized a certain profit. In the following table we compare the realized values with the expected values. In 2014 the realized value was a bit higher, while in 2015 it was a bit lower than expected. The table also shows the importance of delta hedging: without it, the realized value would have been much lower and even negative.
In short, what happened in both 2014 and 2015 in the TTF gas market: price levels gradually fell, and hence the average contract price was 2.27 €/MWh above the gas spot prices. Taking gas from the contract was therefore advantageous on very few days (53 per year on average). Thanks to the delta hedges recommended by KySwing, this was compensated for by a positive hedge P&L. The total realized P&L of spot and forward trading was therefore close to the expected values.
This chapter shows that a combination of spot optimization and delta hedging ensures that the full contract value is realized. With more frequent rehedging than just once per month, the realized P&L could even be closer to the expectation, albeit at probably higher transaction costs. In the following section we will analyse the trading activities in more detail.
3 Hedging a gas contract
3.1 Overview
The trading activity evolves along the following main steps:
- At the valuation date[1], run the KySwing model to:
- Estimate the contract value
- Derive the initial delta hedges -> these are the initial forward trades
- Every day during the contract period, run the KySwing model for the remaining contract period to:
- Estimate the remaining value of the contract
- Decide if it is optimal to take gas from the contract and sell in the spot market
- Every potential rehedge day, once per month or more frequently, use the results from KySwing to:
- Derive the adjusted delta hedges
- Compare these to the existing trading positions
- Trade the difference in the forward market
The 2015 contract serves as an example to clarify each step in more detail.
3.2 Valuation date
On 31 December 2014:
- The model performs a valuation with the market prices of that day. The projected value of the contract is 231,406 €.
- The model advises not to take gas on the next day because the day-ahead spot price of 20.15 is under the contract price of 23.48 €/MWh.
- The model calculates the delta hedges. The corresponding trades are executed on the forward market.
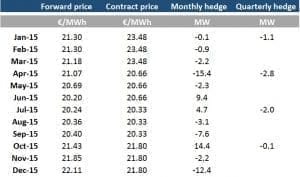
We can make various interesting observations about the delta hedges. First, to put the hedge volumes into perspective, it is useful to know that the maximum offtake of 2,400 MWh per day corresponds to 100 MW. So, with hedges in the range of 0-3 MW per quarter, all quarterly hedges volumes are relatively small.
Second, the hedge volumes are small in the first quarter, because the contract is out-of-the-money: the contract price is known and more than 2 €/MWh above the current forward prices. Therefore, we do not expect that much gas will be taken in the first quarter and only very small hedges are needed.
Third, the hedge volumes are small in the other quarters, because there is virtually no exposure to increasing or decreasing forward prices in Q2-2015, Q3-2015 or Q4-2015. If any of these quarter-ahead prices goes up, the expected contract price rises, but the average market prices rise in parallel.
Finally, the largest hedge volume is actually for an individual month, April-2015. For this month we expect a relatively large off-take: April has a higher forward price than May and (especially) June. As a result, there is a risk that April prices go down and June prices up, which would narrow the April-June spread. Therefore, the delta hedges are negative for April (sell 15.4 MW) and positive for June (buy 9.4 MW). Q3 and Q4 show similar intra-quarter patterns.
3.3 First month and first rehedge day
As part of the analysis, during each day in January 2015 the KySwing model performs a contract valuation and recommends to take gas from the contract or not. During the whole of January, the outcome is always negative: no gas is taken in January, because the contract price of 23.48 €/MWh is higher than the spot price on each day within the month. At the end of the month:
- The model performs a valuation for the remaining contract period, using the current market prices. It also takes into account that no volumes have been taken yet. The projected value of the contract is 220,876 €.
- The forward positions already show a positive P&L as a result of somewhat lower forward prices:
- The MtM profit on the February to December hedges is 15,902 €
- The (very small) January hedge has a realized profit of 115 €
- This means that the combined value is 220,876 + 15,902 + 115 = 236,893 €, still very close to the initial value of 231,406 €.
- The delta hedges for the February to December period are recalculated and compared to the existing positions. The difference is traded in the market. See the Appendix for the exact volumes.
3.4 Second month and second rehedge day
During February 2015, again no volumes are taken. At the end of February:
- The projected value of the contract is 396,257 €, significantly more than before, as a result of increasing forward prices, which is beneficial for March and for Q2.
- On the other hand, the higher forward prices create an MtM loss in the hedge book of 99,571 €.
- Together with a small profit on the February hedge (settled against spot) of 755 €, the total of realized and expected value is 297,441 €. This is about 25% higher than a month before. The main reason is that there was no rehedging during February, whereas forward prices moved up by more than 2 €/MWh. If a trader had rehedged e.g. halfway the upward price path, he would have faced an MtM loss on these extra hedges, and hence a lower total value. In fact, not so frequent rehedging leads to an extra exposure, which works out positively in this month, but could work out negatively in other months.
- Eventually, at the end of February 2015, the trader recalculates the hedges for March to December, and trades the corresponding volumes in the market.
3.5 Other months and rehedge days
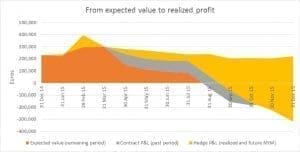
During the remainder of the contract period, we repeated the same set of actions. Progressively, the remaining contract value goes down, while the sum of contract profit and hedge profit goes up. Due to the falling TTF market prices, the contract itself performs quite badly, for which the hedge profit compensates. The end result is slightly below the initial expectation, but relatively close[2].
A detailed breakdown of the profits and losses is provided in the appendix. The following graph summarizes the evolution from expected value to realized profit. The sum of the three areas is the total value; initially this is expected value, whereas at the end the only contributor is the realized profit on the hedges and the contract.
[1] This could e.g. be the date of signing the contract. In our analysis we assume this to be the day before the first delivery day of the contract.
[2] In 2014 the realized profit is actually above the expected value.