Higher spot price volatility: improved outlook for gas storage value
Gas Storage outlook September 2016
In the last months the economic outlook for gas storage improved due to a higher spot price volatility. The value of a gas storage depends largely on the volatility in the spot market, which increased substantially in the last months. When current market circumstances prolong, the outlook for gas storage improves significantly.
An important value driver for a gas storage, in particular a fast cycle storage, is the volatility on the day-ahead spot market. Volatility is a statistical measure for the day-to-day movements of the gas price. The owner of gas storage can benefit from large fluctuations in gas prices by changing the decision to withdraw and inject. When the gas spot price is relatively high, it is attractive to withdraw, and sell gas on the market. When the gas spot price is relatively low, it is attractive to inject gas in the storage and sell it later at a higher price. More volatility means potentially larger spreads between the days of injection and the days of withdrawal.
Daily price fluctuations
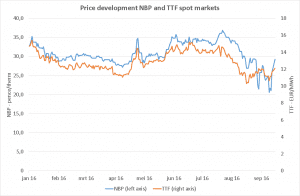
Volatility can be measured by looking at historical price developments. In the last weeks there have been large price fluctuations on the main European trading hubs. Both the Dutch TTF and even more on the UK NBP market displayed this trend. Summer gas prices were low, also because of injection outages at the UK Rough storage and high inventories across continental European storages. In line with the increased power demand in the last weeks, also gas prices picked up. The large price fluctuations could be categorized as a temporary situation, although high spot market volatility is sometimes an indicator for a longer period with large price fluctuations.
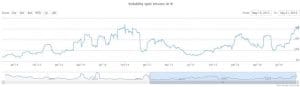
Based on the observed spot prices, the historical volatility can be calculated. The following graph shows the development of the TTF spot price volatility, calculated on a rolling 1 month window. Today’s 80% volatility belongs to the highest levels we have seen in more than 3 years.
The increased volatility is observed in all European gas markets. In the UK, where the price jumps have even been higher, the spot volatility spikes to almost 200%. The table shows a summary of the spot volatility for various West-European gas markets using 1 month of history.
| TTF | NBP | NCG | Gaspool | PEG-Nord | |
| Volatility | 80% | 180% | 74% | 80% | 85% |
Impact volatility on storage value
To demonstrate the impact of spot price volatility on the value of a gas storage we created a reference case with 3 volatility assumptions. In this calculation all other inputs are kept equal. We made all calculations with our KyStore gas storage valuation software. It shows that the storage value increases with 21% in case spot volatility increases from 50% to 75%. Storage value will more than double in case the volatility increases from 25% to 75%. The main valuation assumptions are listed at the bottom of this article.
| Volatility | [%] | 25% | 50% | 75% |
| Value | [€ / MWh] | € 2.56 | € 4.38 | € 5.33 |
Summary
The numerical example illustrates the large influence of spot price volatility on the value of a gas storage. There are fundamental reasons to believe that volatility could remain high. In the UK for instance as result of more CCGT power production, or the reduced injection rates at Rough. When the current market circumstances do prolong, the outlook for gas storage improves significantly.
Main valuation assumptions:
- Valuation period: 1 Apr 2017 – 1 Apr 2018
- Forward curve: daily TTF price forward curve (source: pricecurves.com), 16 September 2016
- 60 days injection, 30 days withdrawal
- Injection costs € 0.20 per MWh