FAQ
Go to category: Commodity trading | Gas storage | Gas trading | Power trading | Renewable energyCommodity trading
What is a commodity accumulator?
An accumulator is a popular financial product in commodity markets. It is mostly used in agricultural commodity markets, such as corn, wheat, soybeans, sugar, cacao and coffee, but also in other markets like aluminium and copper.
There are two main elements of an accumulator: volume and price. The price is fixed, but the underlying volume accumulates over time depending on the price development of a reference futures contract.
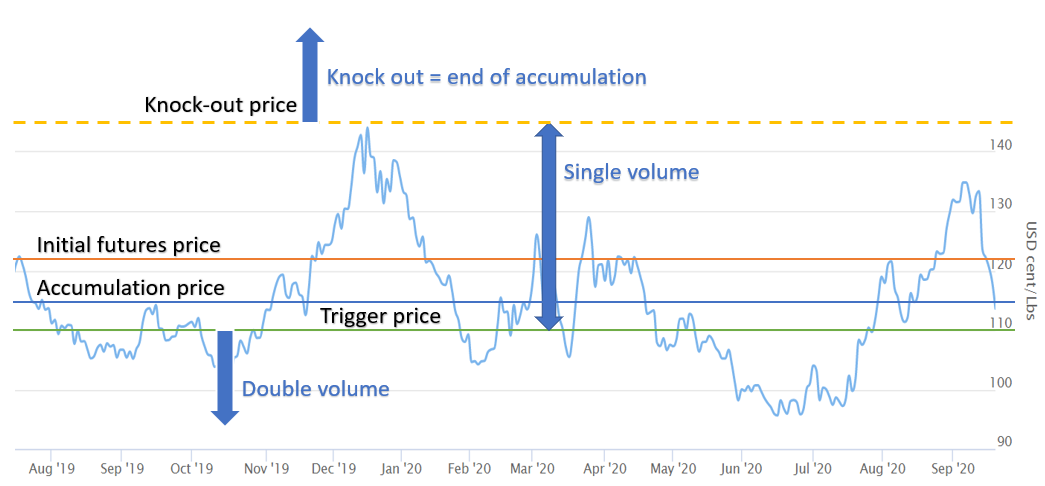
We take an accumulator contract on the September 2020 future for Coffee Arabica as an example. The accumulator is sold by a bank to a coffee blender at an accumulation price of 1.15 $/lbs, at a time when the futures contract is trading at 1.22 $/lbs. Between the signing date of the contract and the expiry date of the September 2020 future, the volume increases every day by 100,000 lbs. When the futures price drops below the trigger price of 1.10 $/lbs, however, the daily accumulation volume doubles. At the end of the contract period, the accumulator contract is financially settled. Suppose the total accumulation volume is 40 mln lbs and the settlement price is 1.19, then the bank pays the coffee blender 0.04 x 40 mln = 1.6 mln $. When the settlement price is below the accumulation price, the coffee blender pays the bank.
Without the double-up of the volumes below the trigger price, a bank would never offer this accumulator contract to the coffee company, because the price of 1.15 is below the current market price of 1.22 $/lbs. However, when the market price drops below the trigger price, it is likely that the bank will make money on the contract. Hence it is advantageous for the bank that volumes double. In fact, the relatively low price of 1.15 is financed by the bank with this exotic put option, which is embedded as a double-up in the accumulation contract.

Another element the bank could include is the inclusion of a knock-out option, a type of barrier option. With this knock-out option, the accumulation stops when the futures price rises above the knock-out price. This limits the potential losses for the bank. Both upsides for the bank allow it to sell the accumulator contract at an accumulation price below the current market price.
Accumulators are over-the-counter structures, allowing for many different forms. On top of the basis accumulator, a contract may have additional accumulators with their own accumulation prices, trigger prices and barrier options. At the initiation date of the contract, to avoid any upfront premium payments, the different price levels must be such that the initial mark-to-market value is zero.
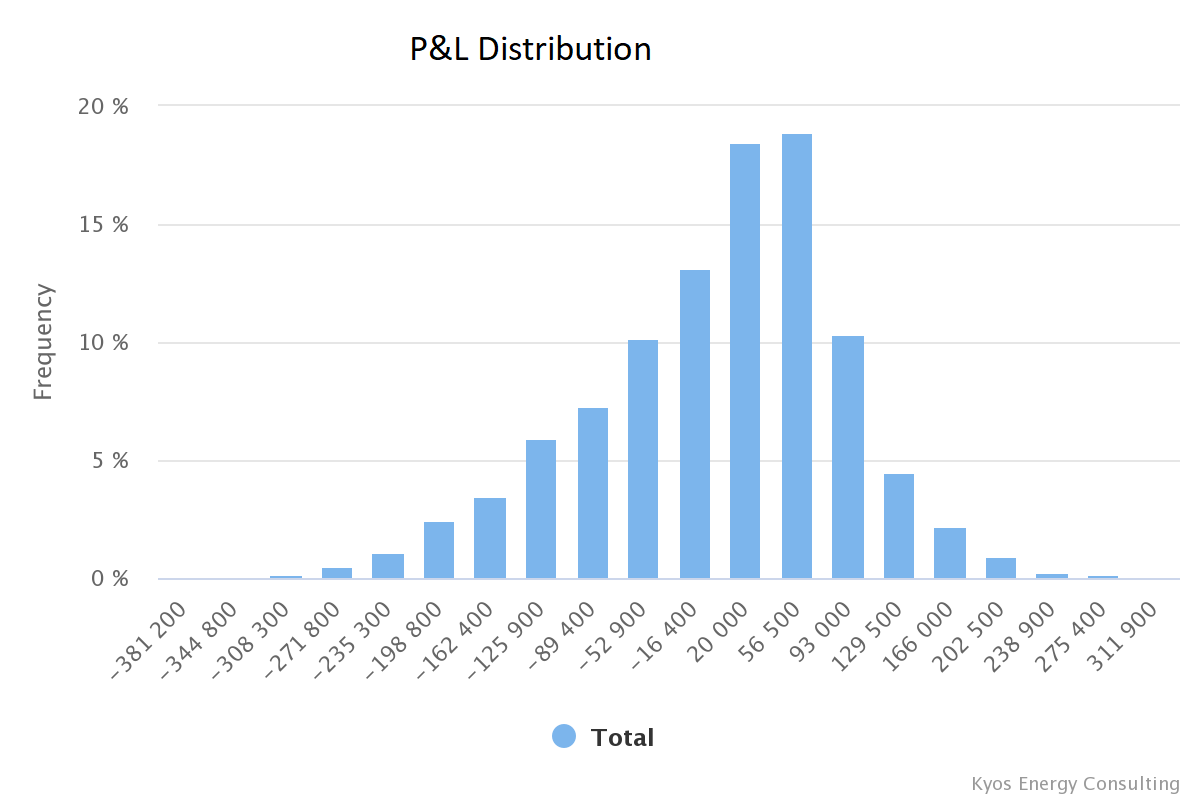
The best valuation methodology for these structures is based on Monte Carlo simulations, because the value of an accumulator depends on the price development over the entire accumulation period. The Monte Carlo valuation can yield a range of useful statistics, including a distribution of prices, volumes and mark-to-market.
The KYOS CTRM system is unique in its capability of capturing all types of accumulator contracts. For example, it shows the historical performance and the fair value of all the contracts. Plus the net position, exposures, mark-to-market and expected cash-flows, either stand-alone or in combination with the rest of your portfolio. The KYOS CTRM is a web based application which can easily interface with other systems and data providers. Click here to read more.
There are two main elements of an accumulator: volume and price. The price is fixed, but the underlying volume accumulates over time depending on the price development of a reference futures contract.
Example of a basis commodity accumulator contract
We take an accumulator contract on the September 2020 future for Coffee Arabica as an example. The accumulator is sold by a bank to a coffee blender at an accumulation price of 1.15 $/lbs, at a time when the futures contract is trading at 1.22 $/lbs. Between the signing date of the contract and the expiry date of the September 2020 future, the volume increases every day by 100,000 lbs. When the futures price drops below the trigger price of 1.10 $/lbs, however, the daily accumulation volume doubles. At the end of the contract period, the accumulator contract is financially settled. Suppose the total accumulation volume is 40 mln lbs and the settlement price is 1.19, then the bank pays the coffee blender 0.04 x 40 mln = 1.6 mln $. When the settlement price is below the accumulation price, the coffee blender pays the bank.
The double-up option
Without the double-up of the volumes below the trigger price, a bank would never offer this accumulator contract to the coffee company, because the price of 1.15 is below the current market price of 1.22 $/lbs. However, when the market price drops below the trigger price, it is likely that the bank will make money on the contract. Hence it is advantageous for the bank that volumes double. In fact, the relatively low price of 1.15 is financed by the bank with this exotic put option, which is embedded as a double-up in the accumulation contract.
The knock-out barrier option
Another element the bank could include is the inclusion of a knock-out option, a type of barrier option. With this knock-out option, the accumulation stops when the futures price rises above the knock-out price. This limits the potential losses for the bank. Both upsides for the bank allow it to sell the accumulator contract at an accumulation price below the current market price.
Additional accumulators
Accumulators are over-the-counter structures, allowing for many different forms. On top of the basis accumulator, a contract may have additional accumulators with their own accumulation prices, trigger prices and barrier options. At the initiation date of the contract, to avoid any upfront premium payments, the different price levels must be such that the initial mark-to-market value is zero.
Monte Carlo valuation of commodity accumulators
The best valuation methodology for these structures is based on Monte Carlo simulations, because the value of an accumulator depends on the price development over the entire accumulation period. The Monte Carlo valuation can yield a range of useful statistics, including a distribution of prices, volumes and mark-to-market.
Commodity accumulator contracts in the KYOS CTRM
The KYOS CTRM system is unique in its capability of capturing all types of accumulator contracts. For example, it shows the historical performance and the fair value of all the contracts. Plus the net position, exposures, mark-to-market and expected cash-flows, either stand-alone or in combination with the rest of your portfolio. The KYOS CTRM is a web based application which can easily interface with other systems and data providers. Click here to read more.
What is an indexed contract?
An indexed contract is very common in commodity markets, especially gas markets. It is also referred to as floating or variable price contract. It means that the price paid for the commodity depends on the evolution of market prices, spot or forward. The index price may be the price on that day or the average price over a certain historical time window.
The index may consist of settlement prices from an exchange or price assessments from an agency such as Platt’s, Argus or ICIS Heren. It is important to select the right index price. Firstly, the market price(s) must be published by a trustworthy organization, now and in the future, using a transparent methodology. Secondly, the market of the index must be sufficiently liquid to ensure that no party can easily manipulate the level of the index price. Finally, if the index market (e.g. Henry Hub) is different from the physical market (a local hub), it should be strongly correlated with the physical market or else have a strong correlation with the exposure of the buyer.
Depending on the portfolio and activities of the buyer and seller, an indexed contract is good for managing risks. For example, if the buyer wants absolute price certainty over the duration of the contract, then it is safer to buy at a fixed price. However, if he always wants to be close to the market, then an indexed contract is the better choice.
An indexed contract tends to contain less optionality than a fixed price contract: the difference between the contract price and the market price is generally smaller and less volatile. This reduces the arbitrage trading opportunities in the market, and hence the option value.
Advanced financial methodologies are needed for the calculation of the market option value, the price exposures, and the daily management of indexed contracts. KYOS is a specialist in this area with its software products KYOS Analytical Platform and KySwing.
Do you want to know more about swing options, read our monthly gas market report or check the KySwing webpage.
What is a guarantee of origin?
A guarantee of origin (GoO) is an electronic document which proves electricity originates from a specific energy source. It is mainly issued for renewable energy sources. A guarantee of origin enables the traceability of green energy from the producer to the final consumer, even though the electricity networks obviously do not distinguish between different types of electricity.
A Guarantee of Origin (GoO) is similar to a green certificate, in that it proofs that power has been produced from a specific source. However, GoOs can be issued independently from governmental policies. Furthermore, GoOs do not necessarily apply to renewable production only, although the renewable GoOs are most common, such as for Nordic and Alpine hydro power, and Northern continental Europe wind power.
The price of the guarantee of origin depends on the willingness of final consumers to pay for green energy. Furthermore, the price depends on the specific source: a Nordic hydro power GoO may be less valuable than a GoO of local wind or solar production. This is because consumers realize that the purchase of a hydro GoO may not lead to any incentive for more renewable production, whereas a local wind or solar GoO is more likely having an impact. It is somewhat arguable whether a guarantee of origin stimulates green investments: price levels are rather low and have very little impact on the profitability of new investments.
As opposed to emission certificates, and similar to green and white certificates, the total market size for GoOs is quite small and trading rather illiquid, maybe with the exception of two or three types of GoO. Most trading activity is via brokers, such as STX, Cleanworld, Evolution Markets and Amsterdam Capital Trading.
Do you want to know more about the KYOS price forecasting services, read more on Price Analytics or contact us directly.
What is a green certificate?
A green certificate is a tradable asset which proves that electricity has been generated by a renewable (green) energy source. It is also referred to as Renewable Energy Certificate (REC), Renewable Obligation Certificate (ROC) or more generally a Guarantee of Origin (GO or GoO) from a renewable energy source.
Green certificates are traded for compliance reasons or on a voluntarily basis. Green certificates are issued and traded in compliance markets because of governmental policies which require suppliers to have a certain percentage of renewable production in their supply portfolio. With green certificates, governments can set exact targets as to the level of renewable production in a country, while the market finds the most efficient way to meet these targets. It is an alternative to other policy mechanisms, such as renewable investment subsidies, renewable production subsidies, fiscal benefits and feed-in tariffs. A green certificate is typically issued per 1 MWh of renewable power, but in compliance markets the number of green certificates may depend on the source, whereby greener or more innovative technologies obtain more certificates than other technologies per MWh of power produced.
Green certificates, or more generally Guarantees of Origin, are purchased on a voluntary basis to get guaranteed green electricity. This allows end-users, businesses and households alike, to reduce their CO2 footprint. For corporates, this has commercial benefits, as it improves their reputation and provides a competitive edge in a society in which awareness and the importance of environmental impacts are ever increasing.
A green certificate may be considered the opposite of an emission certificate. Whereas emission certificates, such as EUA’s (EU Allowances), impose a cost on non-renewable production and set a maximum to the total emissions, green certificates create an extra revenue for renewable production and guarantee a minimum of renewable production.
The price of the green certificates depends on the scarcity in the market. The price is higher when the green certificates scheme is driven by tight targets of government policies. Certificates cannot be transferred between the European markets, as opposed to emission certificates, so the total market size is often small and trading rather illiquid.
This is one of the reasons why compliance markets for green certificates have lost popularity in recent years and just a few European countries still rely on this mechanism, including Belgium, Sweden, Norway and Poland. Most markets have been nationally organised, except for Norway and Sweden, which have the joint Elcertificates market (ElCert). Most trading activity is via brokers, such as STX, Cleanworld, Evolution Markets and ACT, or via the Green Power Hub platform.
Follow the links if you wish to know more about the KYOS price analytics, or about our services in renewable energy and PPA contracts. You can also find more in-depth information about green certificates in this article on renewable certificates.
Alternatively, please contact us directly.
Instrument for governments to encourage renewable energy production
Green certificates are traded for compliance reasons or on a voluntarily basis. Green certificates are issued and traded in compliance markets because of governmental policies which require suppliers to have a certain percentage of renewable production in their supply portfolio. With green certificates, governments can set exact targets as to the level of renewable production in a country, while the market finds the most efficient way to meet these targets. It is an alternative to other policy mechanisms, such as renewable investment subsidies, renewable production subsidies, fiscal benefits and feed-in tariffs. A green certificate is typically issued per 1 MWh of renewable power, but in compliance markets the number of green certificates may depend on the source, whereby greener or more innovative technologies obtain more certificates than other technologies per MWh of power produced.
Green certificates, or more generally Guarantees of Origin, are purchased on a voluntary basis to get guaranteed green electricity. This allows end-users, businesses and households alike, to reduce their CO2 footprint. For corporates, this has commercial benefits, as it improves their reputation and provides a competitive edge in a society in which awareness and the importance of environmental impacts are ever increasing.

Green certificates from hydro power
Green Certificate trading
A green certificate may be considered the opposite of an emission certificate. Whereas emission certificates, such as EUA’s (EU Allowances), impose a cost on non-renewable production and set a maximum to the total emissions, green certificates create an extra revenue for renewable production and guarantee a minimum of renewable production.
The price of the green certificates depends on the scarcity in the market. The price is higher when the green certificates scheme is driven by tight targets of government policies. Certificates cannot be transferred between the European markets, as opposed to emission certificates, so the total market size is often small and trading rather illiquid.
This is one of the reasons why compliance markets for green certificates have lost popularity in recent years and just a few European countries still rely on this mechanism, including Belgium, Sweden, Norway and Poland. Most markets have been nationally organised, except for Norway and Sweden, which have the joint Elcertificates market (ElCert). Most trading activity is via brokers, such as STX, Cleanworld, Evolution Markets and ACT, or via the Green Power Hub platform.
Follow the links if you wish to know more about the KYOS price analytics, or about our services in renewable energy and PPA contracts. You can also find more in-depth information about green certificates in this article on renewable certificates.
Alternatively, please contact us directly.
What is ETRM?
ETRM stands for Energy Trade and Risk Management. CTRM stands for Commodity Trading and Risk Management. The names are used for a range of software solutions which support the trading and risk management of commodities.
Commodity prices are often rather volatile and constitute a large portion of the total costs of production. Comprehensive ETRM and CTRM solutions support both physical and financial trading, and can deal with a wide variety of commodities, not only energy: power, natural gas, soft commodities (agri), metals, crude oil and oil derivatives, plastics, and more.
The solutions provide a transparent view of complex portfolios, and are used by energy producers, energy suppliers, large energy consumers and other companies with significant commodity price exposures. The systems aid both front office (traders), middle office and risk management, and back office.
ETRM solutions ideally provide front-to-back support. This includes:
Each system has its own strengths and weaknesses, and each focusing on particular commodities, functional areas or user groups.
Does your company have a significant exposure to commodity prices? Then KYOS has a cost-effective solution for your daily management. The KYOS application has been primarily designed for industrial companies with diverse commodity exposures and contracts across different business units and site locations.
Many industrial companies struggle to get a complete overview of the commodity price exposures, and this is where the KYOS application proofs to be very useful. It helps financial officers, purchasers and treasury managers to avoid unexpected losses due to commodity price movements, by providing a detailed insight in exposures, expected cash-flows, Mark-to-Market and more. It is a web based application which can easily interface with other systems and data providers. Click here to read more.
ETRM for physical and financial trading
 Commodity prices are often rather volatile and constitute a large portion of the total costs of production. Comprehensive ETRM and CTRM solutions support both physical and financial trading, and can deal with a wide variety of commodities, not only energy: power, natural gas, soft commodities (agri), metals, crude oil and oil derivatives, plastics, and more.
The solutions provide a transparent view of complex portfolios, and are used by energy producers, energy suppliers, large energy consumers and other companies with significant commodity price exposures. The systems aid both front office (traders), middle office and risk management, and back office.
From front-office to back-office
ETRM solutions ideally provide front-to-back support. This includes:
- deal capturing and price management
- logistics and scheduling
- position management
- risk reporting (VaR, EaR)
- valuation and optimization
- accounting, settlement, regulatory reporting
Each system has its own strengths and weaknesses, and each focusing on particular commodities, functional areas or user groups.
KYOS CTRM
Does your company have a significant exposure to commodity prices? Then KYOS has a cost-effective solution for your daily management. The KYOS application has been primarily designed for industrial companies with diverse commodity exposures and contracts across different business units and site locations.
Many industrial companies struggle to get a complete overview of the commodity price exposures, and this is where the KYOS application proofs to be very useful. It helps financial officers, purchasers and treasury managers to avoid unexpected losses due to commodity price movements, by providing a detailed insight in exposures, expected cash-flows, Mark-to-Market and more. It is a web based application which can easily interface with other systems and data providers. Click here to read more.
Gas storage
What is a virtual gas storage?
Virtual gas storage
A virtual gas storage is similar to a gas storage contract, however it is not (fully) backed by a physical storage. Virtual products have typical simpler contract characteristics than those with fully physical backed products. This increases the ease of negotiating and trading such contracts.
Owners with multiple storages may combine the characteristics of the storages into one virtual version. The resulting pooling effect lead to less physical restriction and a commercially more attractive product.
Virtual gas storage products are traded bilateral between market participants, via brokers or via auctions.
Owners of multiple physical gas storage facilities may combine the characteristics into one virtual version to create a commercially more attractive product.
KYOS Software models and Advisory
Natural gas portfolio management is about managing price and volume risks. KYOS helps to optimize a portfolio with natural gas storage and swing contracts. Trade in the markets to maximize the flexibility value and minimize risks!
For example, our flagship software model KyStore supports traders and portfolio managers in natural gas markets. The gas storage optimization software not only raises revenues from gas storage trading operations, but also provides accurate valuations and reduces risk with adequate hedge recommendations. The model uses advanced stochastics including Least Squares Monte Carlo techniques to capture the full optionality in gas storage facilities.
Since the start of KYOS in 2008, our mission is to serve professionals in the energy business (power, natural gas and renewable) or those working with commodities with superior models to aid with decision-making. Use our analytical models to your advantage!
Please contact us for more information, just fill out the form in the black section below.
What is gas storage marketing?
Gas storage marketing
Gas storage marketing is the process of selling gas from underground gas storages to energy suppliers. Storage owners can sell (parts) of the storage to third parties as storage contracts. Depending on the regulatory regime it can even be a requirement to offer all capacity into the market. Most storage owners offer so-called standard storage bundles. A standard storage bundle contains a fixed ratio of injection capacity, withdrawal capacity and working gas volume. The ratio depends on the physical characteristics of the storage facility. Storage owners can also offer non-standard storage products, sometimes including even only injection capacity, withdrawal capacity or working gas volume.
Generally speaking, storage contracts can be marketed during pre-announced auctions, during bilateral negotiations or as a result of regulatory allocation. Storage contracts can be for one storage year, multiple storage years or for shorter periods.
Furthermore, the transfer of storage rights is governed by a standard storage agreement (SSA).
Gas storage marketing is the process of selling gas from underground gas storages to energy suppliers, though auctions, negotiations or regulatory allocations.
KYOS Software models and Advisory
Natural gas portfolio management is about managing price and volume risks. KYOS helps to optimize a portfolio with natural gas storage and swing contracts. Trade in the markets to maximize the flexibility value and minimize risks!
For example, our flagship software model KyStore supports traders and portfolio managers in natural gas markets. The gas storage optimization software not only raises revenues from gas storage trading operations, but also provides accurate valuations and reduces risk with adequate hedge recommendations. The model uses advanced stochastics including Least Squares Monte Carlo techniques to capture the full optionality in gas storage facilities.
Please contact us for more information, just fill out the form in the black section below.
What is cushion gas?
Cushion gas
Cushion gas is the amount of gas that is permanently stored in a natural gas storage. The main function is to maintain sufficient pressure in the storage to allow for adequate injection and withdrawal rates at all times. Another name for this type of gas is base gas.
The amount of required cushion gas depends on the type of storage. For example, in depleted gas reservoirs around 50% of the total volume consists of cushion gas. In comparison, salt caverns require typically around 25% of the total volume. Aquifer reservoirs require more: up to 80% of the total volume. In short, the exact amount required depends on the exact characteristics of the storage and the required withdrawal rates.

A natural gas storage requires cushion gas, or base gas to maintain sufficient pressure in the cavern. This way, it allows for adequate injection and withdrawal rates at all times.
As a result, cushion gas is an important cost element for a gas storage project. It can amount to 50%-80% of the total investment costs. You can only withdraw this gas at the end of the lifetime of a gas storage facility.
KYOS Software models and Advisory
Natural gas portfolio management is about managing price and volume risks. KYOS helps to optimize a portfolio with natural gas storage and swing contracts. Trade in the markets to maximize the flexibility value and minimize risks!
For example, our flagship software model KyStore supports traders and portfolio managers in natural gas markets. The gas storage optimization software not only raises revenues from gas storage trading operations, but also provides accurate valuations and reduces risk with adequate hedge recommendations. The model uses advanced stochastics including Least Squares Monte Carlo techniques to capture the full optionality in gas storage facilities.
Please contact us for more information, just fill out the form in the black section below.
What is working gas volume?
Working Gas Volume
The working gas volume (WGV) is the amount of natural gas that can be injected, stored and withdrawn during the normal commercial operation of a natural gas storage facility. The definition of WGV is the total volume of a gas storage minus the cushion gas. The cushion gas is the gas that is required to stay in the gas storage to maintain adequate pressure and injection and withdrawal rates in the storage.
Natural gas storage facility in Russia
KYOS Software models and Advisory
Natural gas portfolio management is about managing price and volume risks. KYOS helps to optimize a portfolio with natural gas storage and swing contracts. Trade in the markets to maximize the flexibility value and minimize risks!
For example, our flagship software model KyStore supports traders and portfolio managers in natural gas markets. The gas storage optimization software not only raises revenues from gas storage trading operations, but also provides accurate valuations and reduces risk with adequate hedge recommendations. The model uses advanced stochastics including Least Squares Monte Carlo techniques to capture the full optionality in gas storage facilities.
Please contact us for more information, just fill out the form in the black section below.
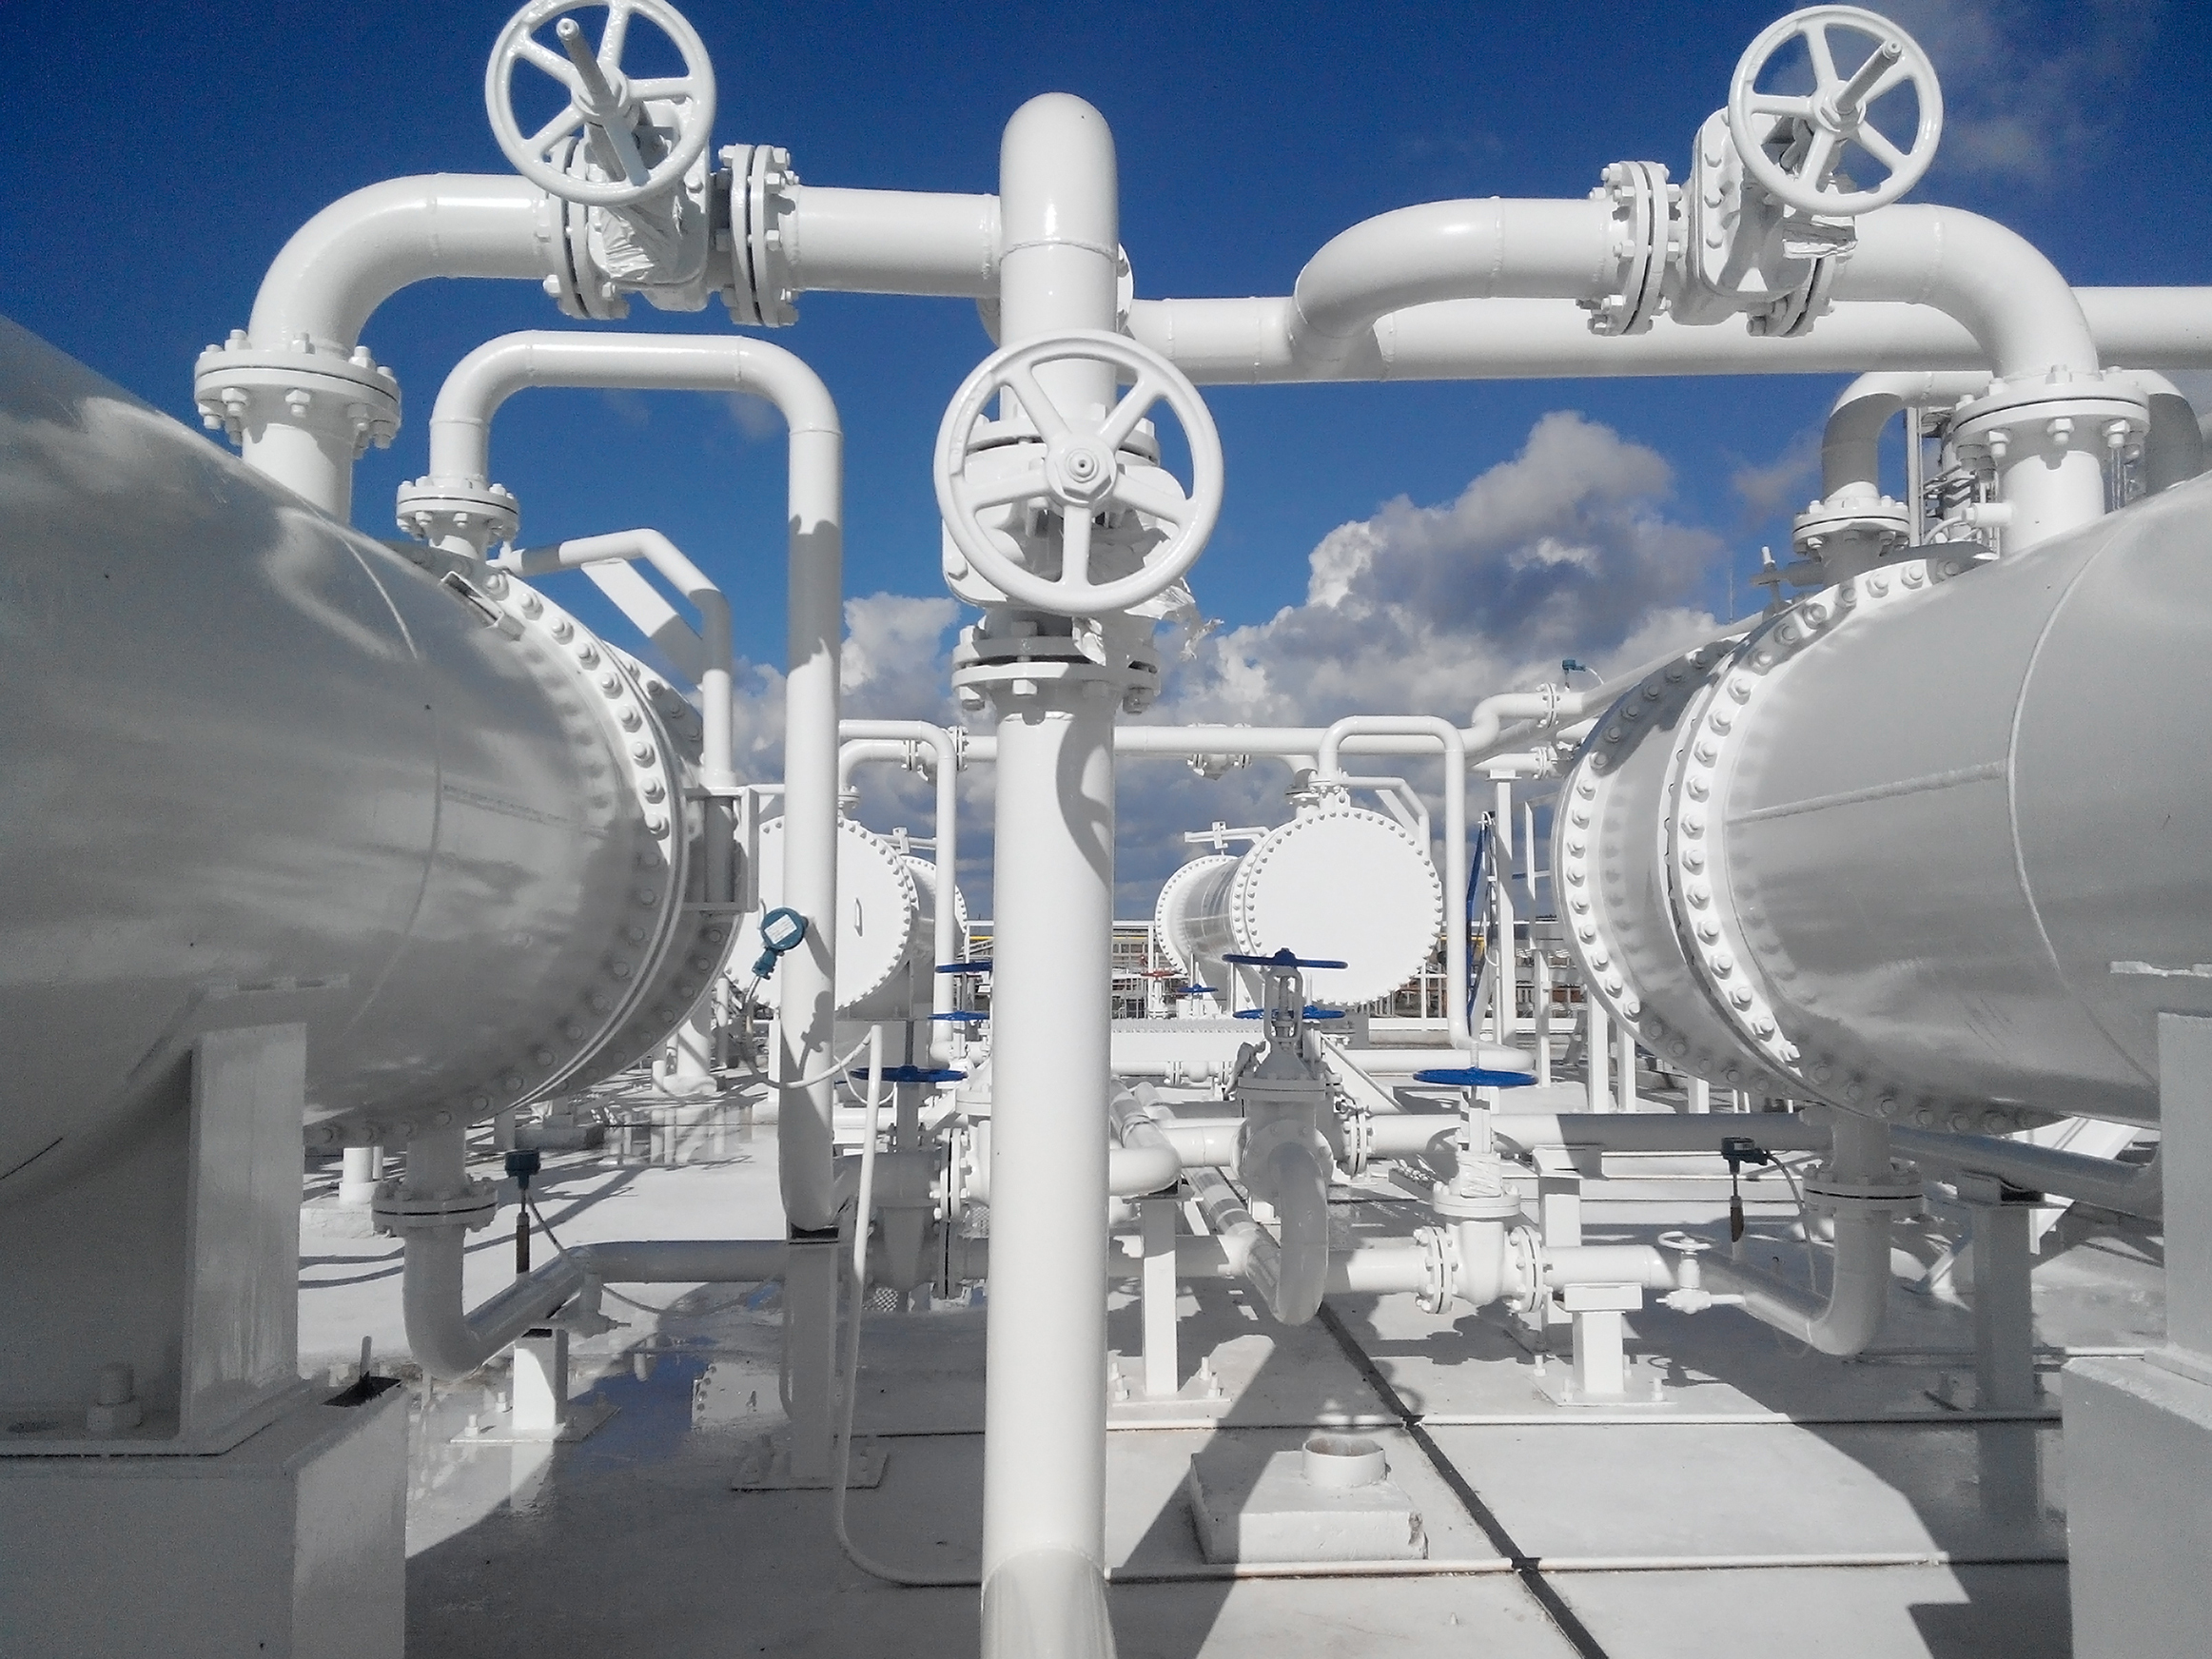
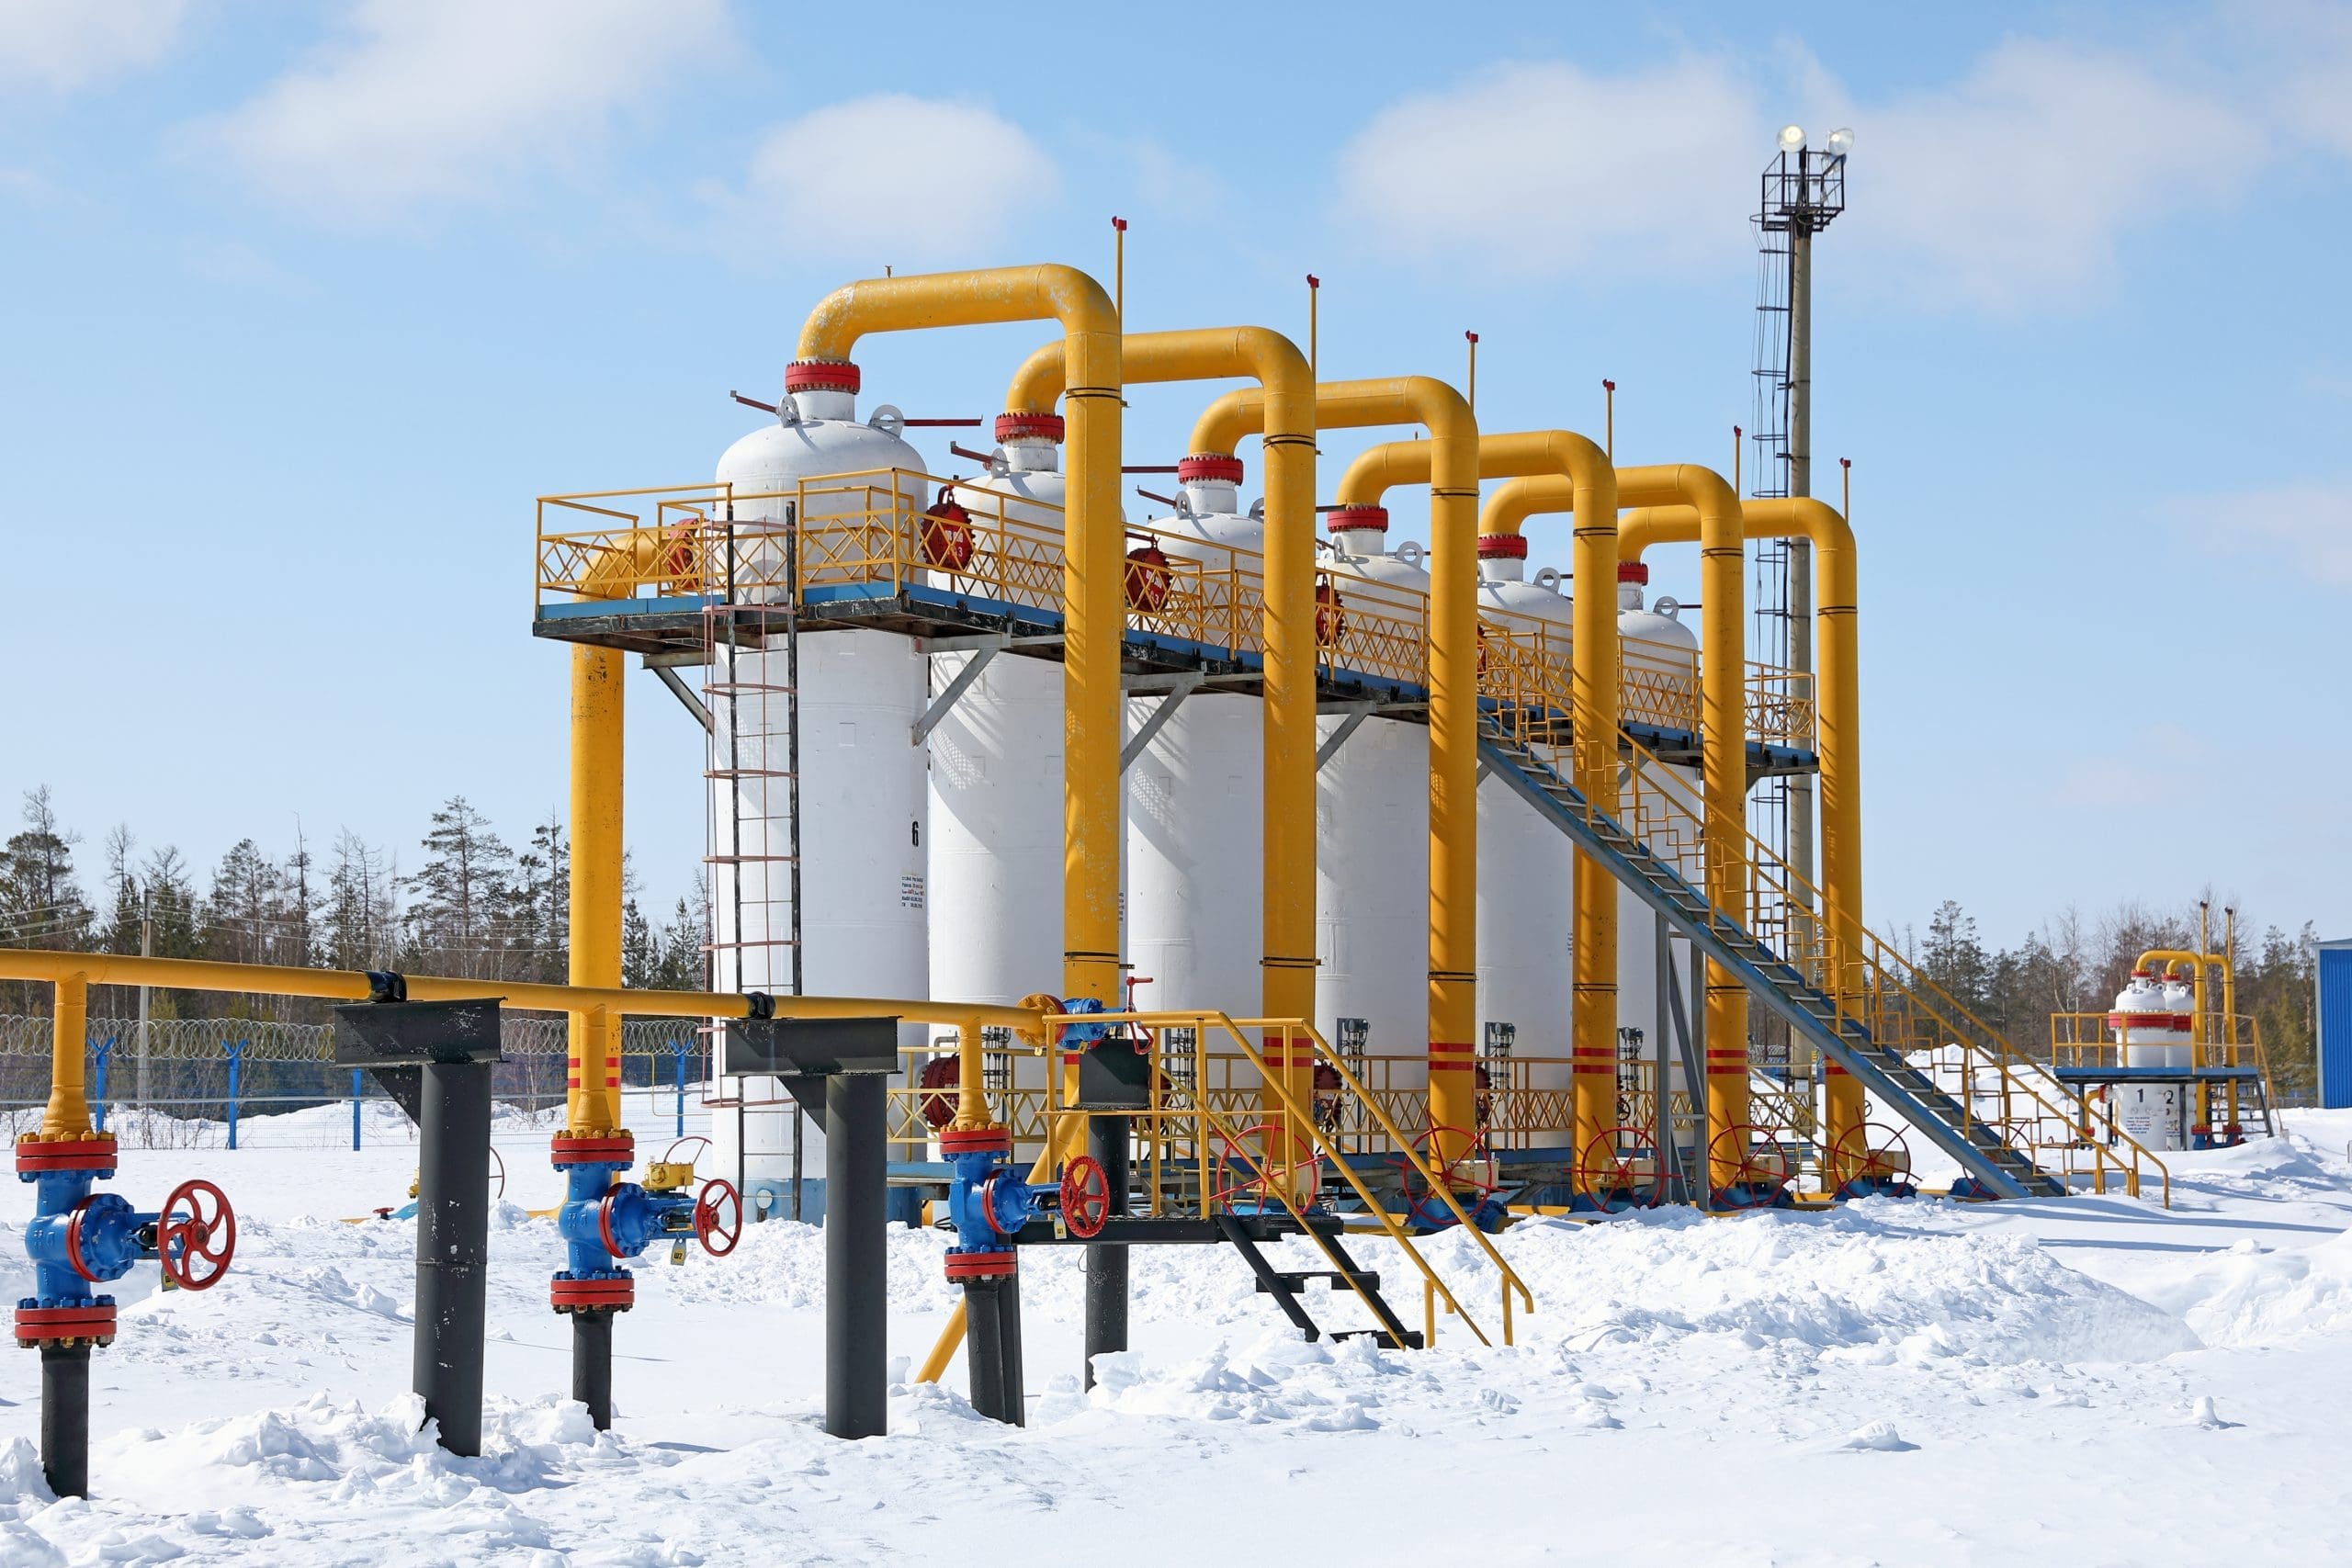
What is a gas storage?
A natural gas storage is a facility that can store natural gas for an indefinite period of time. Natural gas storages are typically located underground and are therefore called as well underground gas storages, or UGS.
The main function of gas storages is to inject and store natural gas at time of low prices and/or low demand and use the gas by withdrawing at times of higher prices and/or higher demand. We can identify three parameters to characterize a gas storage: working gas volume, injection capacity and withdrawal capacity.
The working gas volume is the amount of gas that can be injected into the storage and withdrawn at a later moment in time during normal commercial operation. The working gas volume is smaller than the total volume of the storage. A part of the storage volume needs always be filled with gas. This so-called cushion gas is required to maintain sufficient pressure in the storage to allow for adequate withdrawal rates.
The injection and withdrawal capacity define the maximum rate gas that one can respectively inject or withdraw from the storage. The injection and withdrawal capacity is typically dependent on the pressure level inside the storage. The pressure level depends on the amount of working gas injected, the inventory level.
The inventory level dependent injection and withdrawal parameters are also called ratchets. In case little working gas is injected into the storage, the pressure inside the storage is relatively low. As a result, the injection capacity is typically at its maximum value and the withdrawal capacity at its lowest value. The more working gas is injected into the storage, the higher the pressure. Consequently, the injection capacity decreases and the withdrawal capacity increases.
The storage cycling rate is the number of times a storage can be fully filled and emptied during one year. The cycling rate indicates the main usage of the storage. It is defined by the ratio between injection/withdrawal capacities and the working gas volume. Storages with an injection/WGV ratio of over 100 days are called seasonal storages. These storage have a cycling rate close to 1 and can only be used for one full storage cycle per year.
Seasonal storages are typically used to inject gas during the summer and withdrawal during the winter. Thereby creating the required profile required to supply natural gas to residential customers. Storages with injection/WGV ration of less than 30 days are called fast-churn storages. Fast-churn storages have multiple full storage cycles during a year. These storages are typically used for short-term balancing of a portfolio and/or arbitrage short-term price differentials
The most common types of gas storages are depleted gas reservoirs, salt caverns and aquifer reservoirs.
Depleted gas reservoirs are existing geological formations that have produced parts or all of the economically recoverable gas. The porous rock of many of these formations can be used again to inject, storage and withdrawal natural gas. Using depleted gas reservoirs can have advantages over other types of gas storage. Unproduced gas in the formations can be used as cushion gas, thereby lowering the investment costs. Furthermore, gas reservoirs are in many cases linked to existing gas infrastructure, again lowering investment costs. The cushion gas requirement of depleted gas reservoirs is in the order of 50% of the total storage volume. Gas storages located in depleted reservoirs have typically large working gas volumes, in the order of magnitude of hundreds of million cubic meters up to several billion cubic meters. Most storages in depleted fields are seasonal storages.
Salt caverns are man-made structures in thick layers of underground salt formations. The cavern are created by pumping fresh water down a borehole into the salt layer. The salt dissolves in the water and is pumped back to the surface. This process continues until the required size of the cavern is reached. Salt cavern storages require much less cushion gas than storages in depleted gas reservoirs, typically 25% of the total storage volume. Salt caverns are typically fast-churn storages.
Aquifers are natural, underground, porous formations that contain water reservoirs. The formation can be used to store natural gas. The process of converting a aquifer into a gas reservoir is typically long and expensive. The initial injection cycles need to be very slow to carefully push away the water. The amount of cushion gas required for an aquifer is high and can be up to 80% of the total gas volume. Aquifer gas storages are typically very large and used as seasonal storage.
A natural gas storage site consists of the following main elements:
Natural gas portfolio management is about managing price and volume risks. KYOS helps to optimize a portfolio with natural gas storage and swing contracts. Trade in the markets to maximize the flexibility value and minimize risks!
For example, our flagship software model KyStore supports traders and portfolio managers in natural gas markets. The gas storage optimization software not only raises revenues from gas storage trading operations, but also provides accurate valuations and reduces risk with adequate hedge recommendations. The model uses advanced stochastics including Least Squares Monte Carlo techniques to capture the full optionality in gas storage facilities.
Please contact us for more information, just fill out the form in the black section below.
The main function of gas storages is to inject and store natural gas at time of low prices and/or low demand and use the gas by withdrawing at times of higher prices and/or higher demand. We can identify three parameters to characterize a gas storage: working gas volume, injection capacity and withdrawal capacity.
Working gas volume
The working gas volume is the amount of gas that can be injected into the storage and withdrawn at a later moment in time during normal commercial operation. The working gas volume is smaller than the total volume of the storage. A part of the storage volume needs always be filled with gas. This so-called cushion gas is required to maintain sufficient pressure in the storage to allow for adequate withdrawal rates.
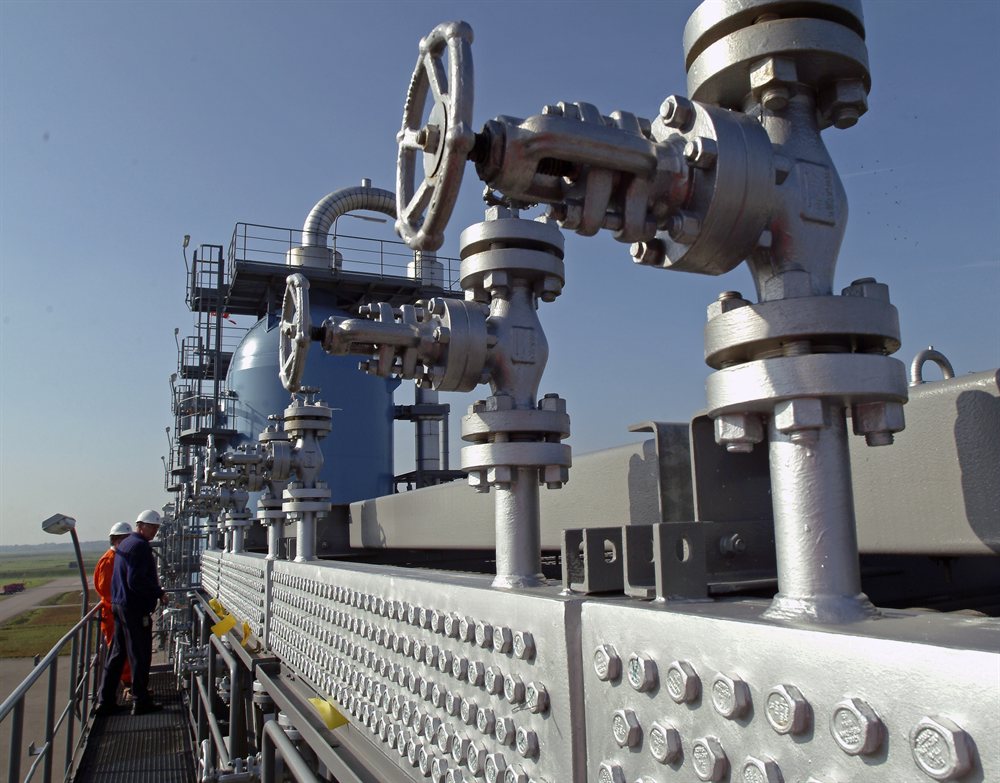
Natural gas storage in Langelo (NL), which was previously a depleted gas reservoir.
Injection and withdrawal capacity
The injection and withdrawal capacity define the maximum rate gas that one can respectively inject or withdraw from the storage. The injection and withdrawal capacity is typically dependent on the pressure level inside the storage. The pressure level depends on the amount of working gas injected, the inventory level.
The inventory level dependent injection and withdrawal parameters are also called ratchets. In case little working gas is injected into the storage, the pressure inside the storage is relatively low. As a result, the injection capacity is typically at its maximum value and the withdrawal capacity at its lowest value. The more working gas is injected into the storage, the higher the pressure. Consequently, the injection capacity decreases and the withdrawal capacity increases.
Storage cycling rate
The storage cycling rate is the number of times a storage can be fully filled and emptied during one year. The cycling rate indicates the main usage of the storage. It is defined by the ratio between injection/withdrawal capacities and the working gas volume. Storages with an injection/WGV ratio of over 100 days are called seasonal storages. These storage have a cycling rate close to 1 and can only be used for one full storage cycle per year.
Seasonal storages are typically used to inject gas during the summer and withdrawal during the winter. Thereby creating the required profile required to supply natural gas to residential customers. Storages with injection/WGV ration of less than 30 days are called fast-churn storages. Fast-churn storages have multiple full storage cycles during a year. These storages are typically used for short-term balancing of a portfolio and/or arbitrage short-term price differentials
Types of gas storages
The most common types of gas storages are depleted gas reservoirs, salt caverns and aquifer reservoirs.
Depleted gas reservoirs are existing geological formations that have produced parts or all of the economically recoverable gas. The porous rock of many of these formations can be used again to inject, storage and withdrawal natural gas. Using depleted gas reservoirs can have advantages over other types of gas storage. Unproduced gas in the formations can be used as cushion gas, thereby lowering the investment costs. Furthermore, gas reservoirs are in many cases linked to existing gas infrastructure, again lowering investment costs. The cushion gas requirement of depleted gas reservoirs is in the order of 50% of the total storage volume. Gas storages located in depleted reservoirs have typically large working gas volumes, in the order of magnitude of hundreds of million cubic meters up to several billion cubic meters. Most storages in depleted fields are seasonal storages.
Salt caverns are man-made structures in thick layers of underground salt formations. The cavern are created by pumping fresh water down a borehole into the salt layer. The salt dissolves in the water and is pumped back to the surface. This process continues until the required size of the cavern is reached. Salt cavern storages require much less cushion gas than storages in depleted gas reservoirs, typically 25% of the total storage volume. Salt caverns are typically fast-churn storages.
Aquifers are natural, underground, porous formations that contain water reservoirs. The formation can be used to store natural gas. The process of converting a aquifer into a gas reservoir is typically long and expensive. The initial injection cycles need to be very slow to carefully push away the water. The amount of cushion gas required for an aquifer is high and can be up to 80% of the total gas volume. Aquifer gas storages are typically very large and used as seasonal storage.
Components of gas storage site
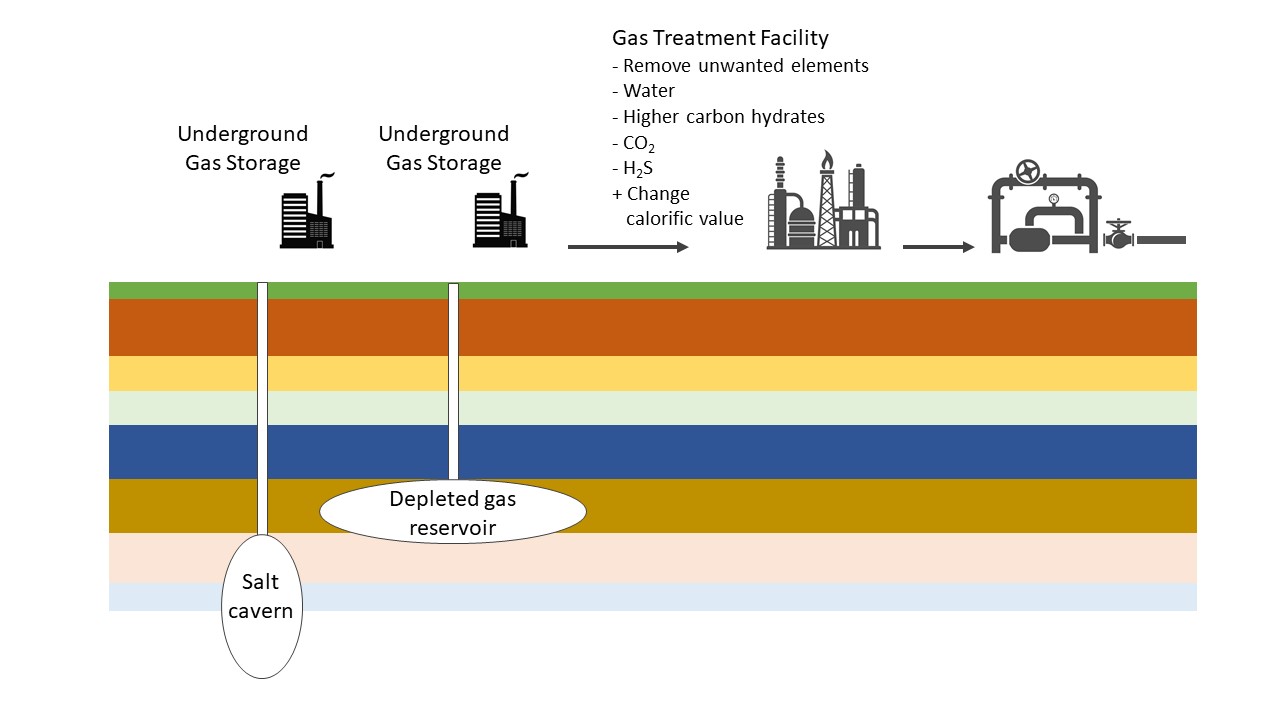
A natural gas storage site consists of the following main elements:
- Storage wells to inject and withdrawal the gas from the underground storage.
- Compressors to inject the gas into and withdrawal from the storage. During the injection compression is necessary in case the storage pressure is higher than the pipeline pressure, typically at high storage level. During withdrawal compression is necessary in case the storage level is lower than the pipeline pressure, typically at low storage level.
- Gas treatment facility. Gas that is withdrawn from the storage may not be at the required specification from the pipeline network. This step may include the removal of unwanted elements, water, higher carbon hydrates, CO2 and H2S. It may also be required to change the calorific value or Wobbe index of the gas before releasing the gas into the gas network.
KYOS Software models and Advisory
Natural gas portfolio management is about managing price and volume risks. KYOS helps to optimize a portfolio with natural gas storage and swing contracts. Trade in the markets to maximize the flexibility value and minimize risks!
For example, our flagship software model KyStore supports traders and portfolio managers in natural gas markets. The gas storage optimization software not only raises revenues from gas storage trading operations, but also provides accurate valuations and reduces risk with adequate hedge recommendations. The model uses advanced stochastics including Least Squares Monte Carlo techniques to capture the full optionality in gas storage facilities.
Please contact us for more information, just fill out the form in the black section below.
Gas trading
What is LNG?
Liquified Natural Gas (LNG) is natural gas that has been cooled down to approximately -162°C to become a liquid. Liquified, it takes about 1/600th of the volume of natural gas in the gaseous state. Natural gas is transformed into its liquified state to transport it economically over longer distances that are not covered by pipelines. It is typically transported in large vessels, but for smaller distances barges or trucks are also being used.
LNG is created from natural gas in a liquefaction plant. During this process, the natural gas will be treated to remove water and other components that will freeze. It can then be stored and transported in special compartments designed for cryogenic temperature. The compartments contain of two layers with a vacuum system in between to reduce heat transfer. Special LNG vessels transport the liquified natural gas from the liquefaction plants to its destination. The destination consists of a regas terminal, where the LNG is transformed again into the gaseous state before being injected into the local gas network.
Liquified natural gas is more and more used in this form, for example as a fuel for trucks, vessels and other means of transportation.
LNG is a traded commodity. Contracts are predominately long-term and often linked to specific liquefaction projects. Traditional long-term contracts have an oil-linked price structure and have a destination clause. With the evolvement of the LNG markets, contracts are getting shorter, more flexible and linked to gas indices as for example the Dutch TTF, US Henry Hub or Asian JKM. Spot trading of LNG cargoes is also expanding.
LNG gas portfolio management is about managing price and volume risks. KYOS offers support to value contracts along the full value chain. We accompany you from valuing liquefaction or regas projects, LNG off-take agreements to LNG storage contracts.
For example, our flagship software model KyStore also works for LNG, and supports traders and portfolio managers in natural gas markets. The gas storage optimization software not only raises revenues from gas storage trading operations, but also provides accurate valuations and reduces risk with adequate hedge recommendations. The model uses advanced stochastics including Least Squares Monte Carlo techniques to capture the full optionality in gas storage facilities.
Please contact us for more information, just fill out the form in the black section below.
LNG is created from natural gas in a liquefaction plant. During this process, the natural gas will be treated to remove water and other components that will freeze. It can then be stored and transported in special compartments designed for cryogenic temperature. The compartments contain of two layers with a vacuum system in between to reduce heat transfer. Special LNG vessels transport the liquified natural gas from the liquefaction plants to its destination. The destination consists of a regas terminal, where the LNG is transformed again into the gaseous state before being injected into the local gas network.

The orange containers are typical for ships carrying liquified natural gas
Liquified natural gas is more and more used in this form, for example as a fuel for trucks, vessels and other means of transportation.
LNG is a traded commodity. Contracts are predominately long-term and often linked to specific liquefaction projects. Traditional long-term contracts have an oil-linked price structure and have a destination clause. With the evolvement of the LNG markets, contracts are getting shorter, more flexible and linked to gas indices as for example the Dutch TTF, US Henry Hub or Asian JKM. Spot trading of LNG cargoes is also expanding.
KYOS Software models and Advisory
LNG gas portfolio management is about managing price and volume risks. KYOS offers support to value contracts along the full value chain. We accompany you from valuing liquefaction or regas projects, LNG off-take agreements to LNG storage contracts.
For example, our flagship software model KyStore also works for LNG, and supports traders and portfolio managers in natural gas markets. The gas storage optimization software not only raises revenues from gas storage trading operations, but also provides accurate valuations and reduces risk with adequate hedge recommendations. The model uses advanced stochastics including Least Squares Monte Carlo techniques to capture the full optionality in gas storage facilities.
Please contact us for more information, just fill out the form in the black section below.
What is a swing option?
A swing option is a contract which provides flexibility as to when and how much of a commodity is taken. The offtaker of the commodity can "swing" (change) the quantity each hour or day. It is most commonly used in natural gas markets, but also in electricity, oil and other commodity markets.
Another name for a swing option is take-or-pay, or take-and-pay contract. This name refers to the minimum quantity that should be taken, or if not taken, should still be paid for. Such a minimum is one of the many volumetric constraints that are possible. Typical constraints are minimum and maximum daily contract quantities (DCQ), annual contract quantities (ACQ) and total contract quantities (TCQ). But essentially, there can be any type of constraint. When a constraint is violated, the option holder pays a penalty.
The price paid for the commodity can be fixed or floating. A floating price or indexed price means that it is the linked to the price or prices in the market. Compared to a fixed price contract, an indexed price contract contains less optionality: the difference between the contract price and the market price is generally smaller and less volatile. This reduces the arbitrage trading opportunities in the market, and hence the option value. On the other hand, if the contract is primarily entered into for acquiring the commodity, not for trading purposes, then an indexed contract ensures that a price close to the market is paid.
Swing contracts offer multiple interdependent exercise moments: they belong to the class of American-style path-dependent options. This means that most of the swing contracts cannot be broken down into plain-vanilla options and hence not be priced with standard solutions, such as the Black-Scholes formula. The market standard methodologies for valuing swing contracts are least-squares Monte Carlo and rolling intrinsic. Both methodologies are embedded in KySwing, a software product dedicated to swing contracts. It calculates the market value, value distributions, delta hedges and a range of other option Greeks.
Do you want to know more about swing options, read our monthly gas market report or check the KySwing web page.
What is a swing contract?
Swing contracts or swing options are typical components of gas contracts, which offer the opportunity to vary the contracted volume under a number of restrictions. They are also known as Take-or-Pay (ToP), interruptible and variable load contracts.
Natural gas portfolio management is about managing price and volume risks. KYOS helps to optimize a portfolio with natural gas storage and swing contracts. Trade in the markets to maximize the flexibility value and minimize risks!
For example, our flagship software model KyStore supports traders and portfolio managers in natural gas markets. The gas storage optimization software not only raises revenues from gas storage trading operations, but also provides accurate valuations and reduces risk with adequate hedge recommendations. The model uses advanced stochastics including Least Squares Monte Carlo techniques to capture the full optionality in gas storage facilities.
Please contact us for more information, just fill out the form in the black section below.
KYOS Software models and Advisory
Natural gas portfolio management is about managing price and volume risks. KYOS helps to optimize a portfolio with natural gas storage and swing contracts. Trade in the markets to maximize the flexibility value and minimize risks!
For example, our flagship software model KyStore supports traders and portfolio managers in natural gas markets. The gas storage optimization software not only raises revenues from gas storage trading operations, but also provides accurate valuations and reduces risk with adequate hedge recommendations. The model uses advanced stochastics including Least Squares Monte Carlo techniques to capture the full optionality in gas storage facilities.
Please contact us for more information, just fill out the form in the black section below.
Power trading
What is the Balancing Mechanism?
The Balancing Mechanism, or BM, is the main mechanism used by National Grid, the TSO in Great-Britain, and by EirGrid, the TSO in Ireland, to balance electricity supply and demand close to real time. Other countries have similar mechanisms and markets for managing the system balance after gate closure.
The diagram shows approximate times for the different transfers between the market segments. At the moment, the exact EPEX Auction times are[1]:
When the TSO predicts that there will be a discrepancy between electricity production and demand during a certain time period, it may accept a ‘bid’ or ‘offer’ from a market participant to either increase or decrease generation (or consumption). The operation of the BM relies on the flow of data and information between the TSO and market participants. This happens in real time to ensure that system balance is maintained. The TSO specifies the interfaces that must be used for these processes, to comply with the Balancing and Settlement Code (BSC).
The process of the Balancing Mechanism is as follows:
The TSOs in GB and Ireland use the Balancing Mechanism as the primary means to balance the system. However, they also use other mechanisms provided as ancillary services by market participants. These include e.g. the Firm Frequency Response (FFR), the short term operating reserve (STOR), Fast Reserve (FR) and Black Start.
Specialized optimization and decision support software assists generators in the Balancing Mechanisms in the GB and Irish markets. An example is the KYOS PN (Physical Notification) software. This real-time trading software uses very detailed information from the power plants and real-time information from the BM to inform the traders about the optimal dispatch of their generation assets and optimal bids and offers in the BM. It also takes care of the communication, via other software, with the TSO.
See also our FAQ on Spot power trading.
For more information about our offerings for the power producers, suppliers and traders, see our page KYOS solutions for power.
[1] https://www.epexspot.com/sites/default/files/download_center_files/20-01-24_TradingBrochure.pdf
The diagram shows approximate times for the different transfers between the market segments. At the moment, the exact EPEX Auction times are[1]:
- Day ahead hourly auction is at 12:00
- Day ahead half-hourly auction is at 15:30
- Intraday half-hourly auction is at 17:30
- Intraday half-hourly auction is at 8:00
When the TSO predicts that there will be a discrepancy between electricity production and demand during a certain time period, it may accept a ‘bid’ or ‘offer’ from a market participant to either increase or decrease generation (or consumption). The operation of the BM relies on the flow of data and information between the TSO and market participants. This happens in real time to ensure that system balance is maintained. The TSO specifies the interfaces that must be used for these processes, to comply with the Balancing and Settlement Code (BSC).
The process of the Balancing Mechanism is as follows:
- Each generator provides a detailed specification of the characteristics of its Balancing Mechanism Units (BMUs), its generation assets. In the GB market this is called Dynamic Data and Ireland refers to Technical Offer Data (TOD). In both cases, the data set contains detailed information about technical capabilities of the BMU. For example, it defines how long it takes to make a cold, warm or hot start, how the generation level is ramped up or down, what are the minimum on and off times, and other relevant generation data.
- Every day, each generator bids into the day-ahead market. After the day-ahead auction results, the market generator knows which bids have been accepted.
- Then the intraday trading process starts, in which the generators buy and sell power with other market participants. The intraday trading activity allows the generators to achieve a feasible and often more profitable dispatch of their asset.
- Trading activity up to gate closure must be notified to the market operator, in the GB market being Elexon. These trades, submitted as Electricity Contract Volume Notifications (EVCNs), establish the position for each generator up to gate closure.
- Before gate closure, the planned dispatch of the power generation asset, is sent to the Electronic Data Transfer (EDT) system of the TSO. The dispatch pattern is the Final Physical Notification (FPN) and consists of a series of elbow points. The elbow points contain the levels of production (in MW) at each half-hour, and all other minutes where there is a change in the speed of ramping up or down. The elbow points are the official schedule of the generation asset (BMU).
- After gate closure, the TSO is responsible for maintaining system balance. The prices at which the TSO may vary the production of generation assets after gate closure, are submitted by the generators via bids and offers. Based on these bids and offers, the TSO issues instructions to the generators to adapt their production in the form of Bid Offer Acceptances (BOAs). The TSO ensures that the variations in production are feasible for the generator, i.e. in line with the TODs of the generation assets and the original dispatch schedule (the elbow points). When accepting these instructions, participants must then act to ensure that their BM units produce the required level of output. A failure to do so results in an imbalance. The variations in production are reconciled and (in the GB market) settled through Elexon’s Central Services. An important distinction between the BM and the wholesale spot markets is that all participants are ‘paid as bid’ not paid the price of the marginal provider of energy.
The TSOs in GB and Ireland use the Balancing Mechanism as the primary means to balance the system. However, they also use other mechanisms provided as ancillary services by market participants. These include e.g. the Firm Frequency Response (FFR), the short term operating reserve (STOR), Fast Reserve (FR) and Black Start.
Specialized optimization and decision support software assists generators in the Balancing Mechanisms in the GB and Irish markets. An example is the KYOS PN (Physical Notification) software. This real-time trading software uses very detailed information from the power plants and real-time information from the BM to inform the traders about the optimal dispatch of their generation assets and optimal bids and offers in the BM. It also takes care of the communication, via other software, with the TSO.
See also our FAQ on Spot power trading.
For more information about our offerings for the power producers, suppliers and traders, see our page KYOS solutions for power.
References
[1] https://www.epexspot.com/sites/default/files/download_center_files/20-01-24_TradingBrochure.pdf
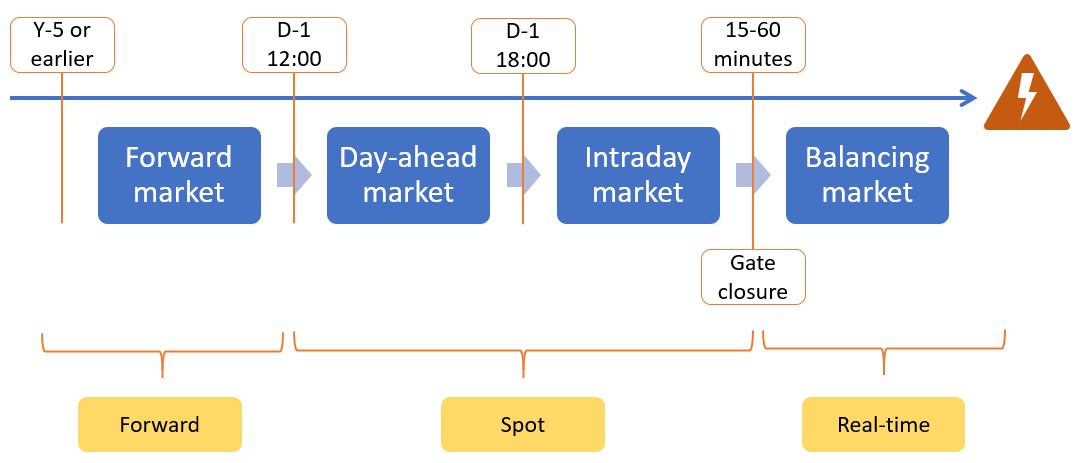
What is spot power trading?
Spot power trading is generally defined as the trading of power in the wholesale market from day-ahead until just before delivery, gate closure. Day-ahead trading on a central day-ahead auction has traditionally been the main market mechanism for spot power trading. However, in response to the increasing penetration levels of intermittent renewable power generation, such as solar and wind, trading dynamics have moved to shorter horizons than day-ahead. Between day-ahead and actual production, the weather patterns can still change significantly, thereby changing the output from renewable generation. Being able to adjust trading positions accordingly, has become a key element to short-term balancing the portfolios of the power market operators, and thereby also balancing the system.
Spot trading can be divided into several segments:
Day-ahead and intraday trading takes place via exchange auctions, continuous exchange trading and continuous over-the-counter (OTC) trading. The largest spot power exchanges in Europe are EPEX Spot and Nord Pool. Other spot power exchanges are often active in just one country, such as PTE in the Polish market and GME in the Italian market. Together with other energy exchanges, they are members of the Association of European Energy Exchanges, Europex. Markets organized by exchanges are anonymous and accessible to all participants satisfying admission requirements. They perform an important role in the pooling of liquidity, transparency, application of market regulation, payment and delivery security.
Market participants in day-ahead spot markets place bids and offers for individual hours or half-hours on the next day. Exchanges also offer the possibility to trade blocks of hours and to group the block bids and offers into families of children and parents. This is especially relevant for power generators which prefer to have continuous production in a series of hours to avoid start-stop costs.
As intraday and balancing markets evolve, so does the necessity to trade as close as possible to the time of delivery. This increases the challenges for power generators in the management of their dispatch operations and maintaining a balanced position. This applies to both intermittent generation, such as solar and wind, as well as flexible power generation, such as conventional assets (gas, coal, biomass, nuclear), hydro power and batteries.
What is the Balancing Mechanism?
For more information about our offerings for the power producers, suppliers and traders, see our page KYOS solutions for power.
Spot trading can be divided into several segments:
- Day-ahead auctions for delivery D+1
- Intraday auctions for delivery D+1 or on the same day D
- Continuous trading for delivery D+1 or on the same day D
- Very short-term balancing trades with the TSO for delivery within the next 60 minutes or so
Day-ahead and intraday trading takes place via exchange auctions, continuous exchange trading and continuous over-the-counter (OTC) trading. The largest spot power exchanges in Europe are EPEX Spot and Nord Pool. Other spot power exchanges are often active in just one country, such as PTE in the Polish market and GME in the Italian market. Together with other energy exchanges, they are members of the Association of European Energy Exchanges, Europex. Markets organized by exchanges are anonymous and accessible to all participants satisfying admission requirements. They perform an important role in the pooling of liquidity, transparency, application of market regulation, payment and delivery security.
Market participants in day-ahead spot markets place bids and offers for individual hours or half-hours on the next day. Exchanges also offer the possibility to trade blocks of hours and to group the block bids and offers into families of children and parents. This is especially relevant for power generators which prefer to have continuous production in a series of hours to avoid start-stop costs.
As intraday and balancing markets evolve, so does the necessity to trade as close as possible to the time of delivery. This increases the challenges for power generators in the management of their dispatch operations and maintaining a balanced position. This applies to both intermittent generation, such as solar and wind, as well as flexible power generation, such as conventional assets (gas, coal, biomass, nuclear), hydro power and batteries.
What is the Balancing Mechanism?
For more information about our offerings for the power producers, suppliers and traders, see our page KYOS solutions for power.
What is power scheduling?
Power scheduling, or load scheduling, is the logistical planning of physical power flows by an operator in the power market. A power market operator is a company which generates power, consumes power or physically trades power in the market. An operator feeds power into the system or takes it from the system at one or more locations.
Program-responsible parties are those operators which communicate directly with the Transmission System Operator (TSO) in a power system. They have an obligation to balance their own portfolio or to contribute to overall system balance. Where possible, the actual power flows are constantly measured. This is e.g. possible at large industries and at larger power generation assets. Other parts of the actual power flows, such as retail consumption or rooftop solar generation, are estimated on the basis of weather data and standard consumption profiles.
Operators must nominate their planned power flows to the TSO, with hourly, half-hourly or quarter-hourly granularity. This nomination starts day-ahead and can be updated closer to the actual time until the so-called gate closure. Gate closure is generally around 1 hour before the actual time of production or consumption.
The TSO grants the capacity to transport power through the network and is responsible for maintaining overall system balance. Once the operator has a physical position he has to nominate to the TSO the planned movements of power. Consequently, the administration and communication between the operators and the TSO plays an important role in the scheduling process.
Scheduling systems and software support the management of short-term physical power flows. They are either individual software applications or modules within a larger energy trade and risk management system. The software may be developed by companies in-house or licensed from external vendors, such as KYOS.
Power scheduling is closely linked to energy trading and risk management, to power demand forecasting, to renewable generation forecasting and to power plant optimization and dispatch. Scheduling systems collect all the positions of the operator, which can be a mix of:
The scheduling system must be connected to all of the above sources of power flows and report those to the TSO. The scheduling system may also optimize the power generation dispatch and trading positions to keep the portfolio in balance; this is called real-time position management. The real-time position management may be a largely manual process or be performed with automated trading software.
KYOS Energy Analytics offers various software models for power producers, utilities and traders. For more information about power market scheduling, power plant dispatch optimization and real-time position management, see KYOS solutions for power.
Program-responsible parties are those operators which communicate directly with the Transmission System Operator (TSO) in a power system. They have an obligation to balance their own portfolio or to contribute to overall system balance. Where possible, the actual power flows are constantly measured. This is e.g. possible at large industries and at larger power generation assets. Other parts of the actual power flows, such as retail consumption or rooftop solar generation, are estimated on the basis of weather data and standard consumption profiles.
Operators must nominate their planned power flows to the TSO, with hourly, half-hourly or quarter-hourly granularity. This nomination starts day-ahead and can be updated closer to the actual time until the so-called gate closure. Gate closure is generally around 1 hour before the actual time of production or consumption.
The TSO grants the capacity to transport power through the network and is responsible for maintaining overall system balance. Once the operator has a physical position he has to nominate to the TSO the planned movements of power. Consequently, the administration and communication between the operators and the TSO plays an important role in the scheduling process.
Scheduling systems and software support the management of short-term physical power flows. They are either individual software applications or modules within a larger energy trade and risk management system. The software may be developed by companies in-house or licensed from external vendors, such as KYOS.
Power scheduling is closely linked to energy trading and risk management, to power demand forecasting, to renewable generation forecasting and to power plant optimization and dispatch. Scheduling systems collect all the positions of the operator, which can be a mix of:
- traded positions,
- varying levels of intermittent power generation, such as wind and solar,
- varying levels of power consumption, both measured and unmeasured (retail) consumption,
- flexible power generation assets,
- interconnection flows between different market areas
The scheduling system must be connected to all of the above sources of power flows and report those to the TSO. The scheduling system may also optimize the power generation dispatch and trading positions to keep the portfolio in balance; this is called real-time position management. The real-time position management may be a largely manual process or be performed with automated trading software.
KYOS Energy Analytics offers various software models for power producers, utilities and traders. For more information about power market scheduling, power plant dispatch optimization and real-time position management, see KYOS solutions for power.
Renewable energy
What is the difference between a virtual and physical PPA?
There are basically two types of power purchase agreements, PPAs: virtual (financial) and physical. A virtual PPA is a financial contract in which the connection between the renewable generation asset and the off-taker is quite loose. For example, the off-take may be in a different market area than the location of the asset. A virtual PPA with a fixed price is essentially a contract-for-differences: for each MWh of power produced by the generator, the buyer pays a price to the generator equal to the fixed price. In return it receives from the generator a variable (spot) price plus the Guarantees of Origin (GoOs).
In a physical PPA structure, the generator and the off-taker must be on the same grid. A physical PPA is generally sleeved by a utility. This means that a utility is in between the generator and the off-taker to deliver the actual electricity, especially to manage the volume fluctuations. For this activity, the utility receives a sleeving fee – which is why a physical PPA is also called a sleeved PPA.
A natural role for a utility is to manage volume fluctuations of an energy portfolio, whereas this is not a natural role for a corporate consumer. Unless the generator is a utility itself, many physical corporate PPAs have a utility to “sleeve” the volumes from generator to corporate consumer.
In such a sleeved corporate PPA, the utility takes care of the short-term forecasting of the production, the daily nominations to the network operator and the short-term balancing, in return for a sleeving fee. In fact, the utility transforms the irregular flow of the renewable generator into a smoother flow for the consumer. With sufficient scale in such operations, a utility benefits from economies of scale and diversification to be of real added value.
KYOS is a recognized expert in the renewable PPA market. We support clients in all financial aspects of the PPA life-cycle with an unrivalled software suite for the valuation and risk management of PPA contracts. Our dedicated and experienced team acts as advisor to individual transactions and helps companies execute a sound risk management strategy. Contact us for more information: info@kyos.com.
Physical PPA
In a physical PPA structure, the generator and the off-taker must be on the same grid. A physical PPA is generally sleeved by a utility. This means that a utility is in between the generator and the off-taker to deliver the actual electricity, especially to manage the volume fluctuations. For this activity, the utility receives a sleeving fee – which is why a physical PPA is also called a sleeved PPA.
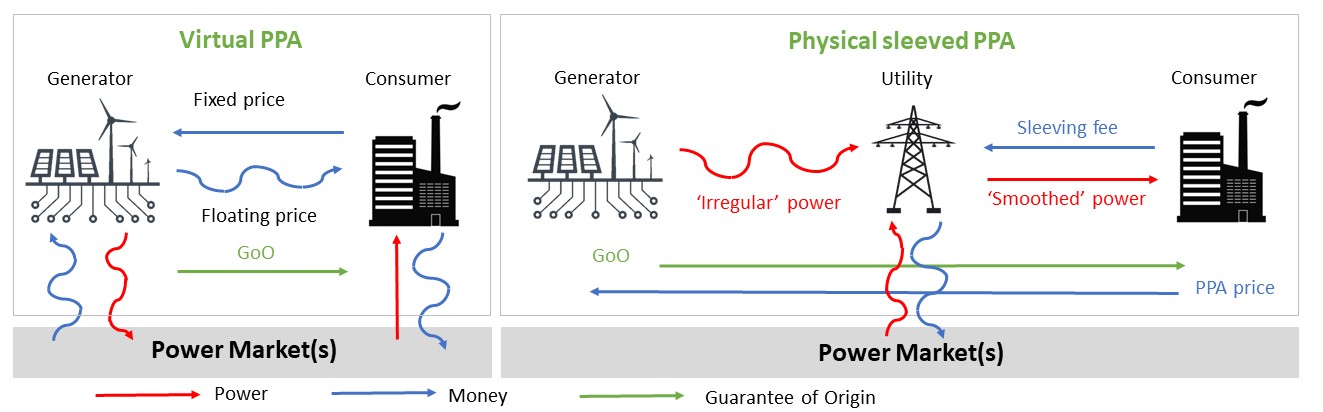
A natural role for a utility is to manage volume fluctuations of an energy portfolio, whereas this is not a natural role for a corporate consumer. Unless the generator is a utility itself, many physical corporate PPAs have a utility to “sleeve” the volumes from generator to corporate consumer.
In such a sleeved corporate PPA, the utility takes care of the short-term forecasting of the production, the daily nominations to the network operator and the short-term balancing, in return for a sleeving fee. In fact, the utility transforms the irregular flow of the renewable generator into a smoother flow for the consumer. With sufficient scale in such operations, a utility benefits from economies of scale and diversification to be of real added value.
KYOS PPA software and services
KYOS is a recognized expert in the renewable PPA market. We support clients in all financial aspects of the PPA life-cycle with an unrivalled software suite for the valuation and risk management of PPA contracts. Our dedicated and experienced team acts as advisor to individual transactions and helps companies execute a sound risk management strategy. Contact us for more information: info@kyos.com.
What are Power Purchase Agreements (PPAs)?
PPAs, or Power Purchase Agreements are contracts between professional parties for the supply of electricity. They are increasingly used to finance renewable generation assets to distribute the financial risks and rewards between asset owners and electricity buyers. They stipulate what volumes from the asset are being sold, at what prices and over what horizon. PPAs are not new; this type of contract has existed for decades in the conventional energy sector as ‘grey PPA’. However, the popularity has risen enormously in the field of renewable generation, and nowadays a PPA generally refers to a ‘renewable PPA’ or ‘green PPA’.
Natural players on the buy side of PPA contracts are the supply companies and utilities. They can integrate the electricity in their portfolio, often already comprising the direct ownership and management of other renewable assets. Utilities redistribute the power to the actual consumers, such as households and businesses. Those end-users can also decide to contract renewable energy directly from the solar park or wind farm. This is the market of so-called corporate PPAs. So far, only the largest corporate companies have entered this space.
The contract duration for a green PPA is often 10 years or longer. One reason is that each contract requires a certain level of structuring. This requires people and money, so is not something you wish to repeat every year. For shorter durations it is cheaper to trade standard contracts in the market place, such as forwards and futures.
Price and volume are other important PPA parameters. The price may be fixed or may be derived from a market index, such as an average power spot or forward price. Indexed contracts may additionally contain caps or floors to limit the price risk to the buyer (cap) or seller (floor).
In a ‘pay-as-produced PPA’, the volume exactly follows the generation of the underlying asset. That is ideal for the generator, but not always so for the consumer, which may have a very different consumption profile. For the benefit of the consumer, the PPA may deliver a flat volume (‘baseload PPA’), potentially with a monthly shape that matches the expected monthly generation profile (‘monthly baseload PPA’).
For more information on how KYOS can help with valuing Power Purchase Agreements (PPA) see our page on Renewables.
Buyers of PPAs
Natural players on the buy side of PPA contracts are the supply companies and utilities. They can integrate the electricity in their portfolio, often already comprising the direct ownership and management of other renewable assets. Utilities redistribute the power to the actual consumers, such as households and businesses. Those end-users can also decide to contract renewable energy directly from the solar park or wind farm. This is the market of so-called corporate PPAs. So far, only the largest corporate companies have entered this space.
Contract parameters
The contract duration for a green PPA is often 10 years or longer. One reason is that each contract requires a certain level of structuring. This requires people and money, so is not something you wish to repeat every year. For shorter durations it is cheaper to trade standard contracts in the market place, such as forwards and futures.
Price and volume are other important PPA parameters. The price may be fixed or may be derived from a market index, such as an average power spot or forward price. Indexed contracts may additionally contain caps or floors to limit the price risk to the buyer (cap) or seller (floor).
In a ‘pay-as-produced PPA’, the volume exactly follows the generation of the underlying asset. That is ideal for the generator, but not always so for the consumer, which may have a very different consumption profile. For the benefit of the consumer, the PPA may deliver a flat volume (‘baseload PPA’), potentially with a monthly shape that matches the expected monthly generation profile (‘monthly baseload PPA’).
For more information on how KYOS can help with valuing Power Purchase Agreements (PPA) see our page on Renewables.