PPA Insights: Solar radiation and wind speed data
Author: Cyriel de Jong, KYOS Energy Analytics
Solar radiation and wind speed data
The financials of renewable power and PPA contracts
 The previous article explained how solar radiation and wind speeds are turned into power production. To assess the expected power output, with all its variability, we investigate the patterns and fluctuations in those weather variables.
Historical weather data
In this article, the focus is firstly on different sources of detailed historical weather data. Some are from direct observations, others are from simulated weather forecasts, or from satellite data. Once weather data are available for a specific location, we can calculate the hypothetical historical power output, and study the fluctuations per hour, day, month and year.
When you are looking for a new house, the real estate agent will tell you that “location is everything”. The same holds true for the location of renewable generation assets. Wind conditions are generally best off-shore, near the coast or in wide fields, and at higher altitudes. Solar conditions are generally best just north or just south of the equator, and in areas with clear skies.
The Global Solar Atlas[1], for example, shows that the direct normal irradiation in parts of North-Africa is more than 2400 kWh/m2 total per year. This is about twice as much as in France, Germany or Japan. Within North-America the numbers vary between around 1000 for Seattle to 1900 in Florida and even up to 3000 in parts of California. The global wind atlas[2] shows similar data for wind speeds at different altitudes above ground level. Whereas the North-Sea (off-shore) has average speeds of 9-10 m/s, it is just around 6-7 m/s in the South of Germany or Japan (on-shore), all measured at 100 m height.
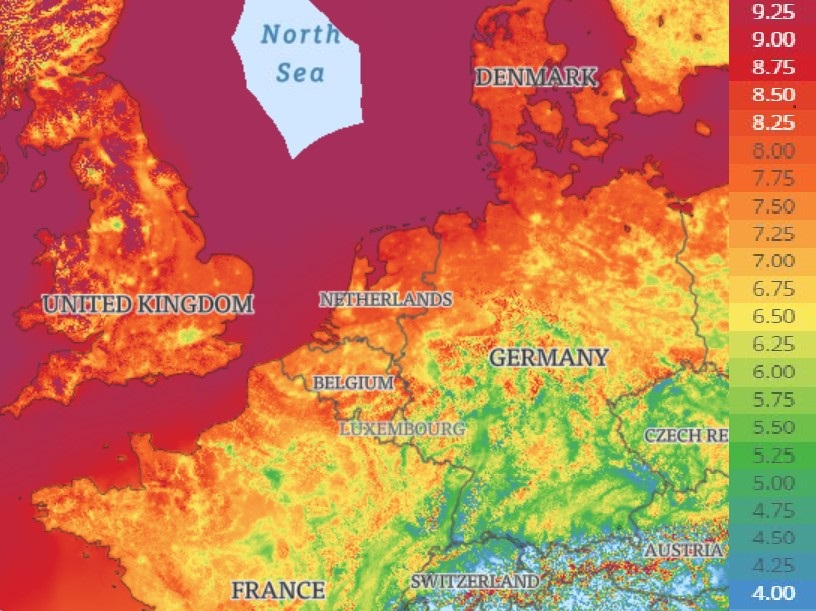
Figure 1: Snapshot of Western Europe from the Global Wind Atlas, with wind speeds at 100 m height.
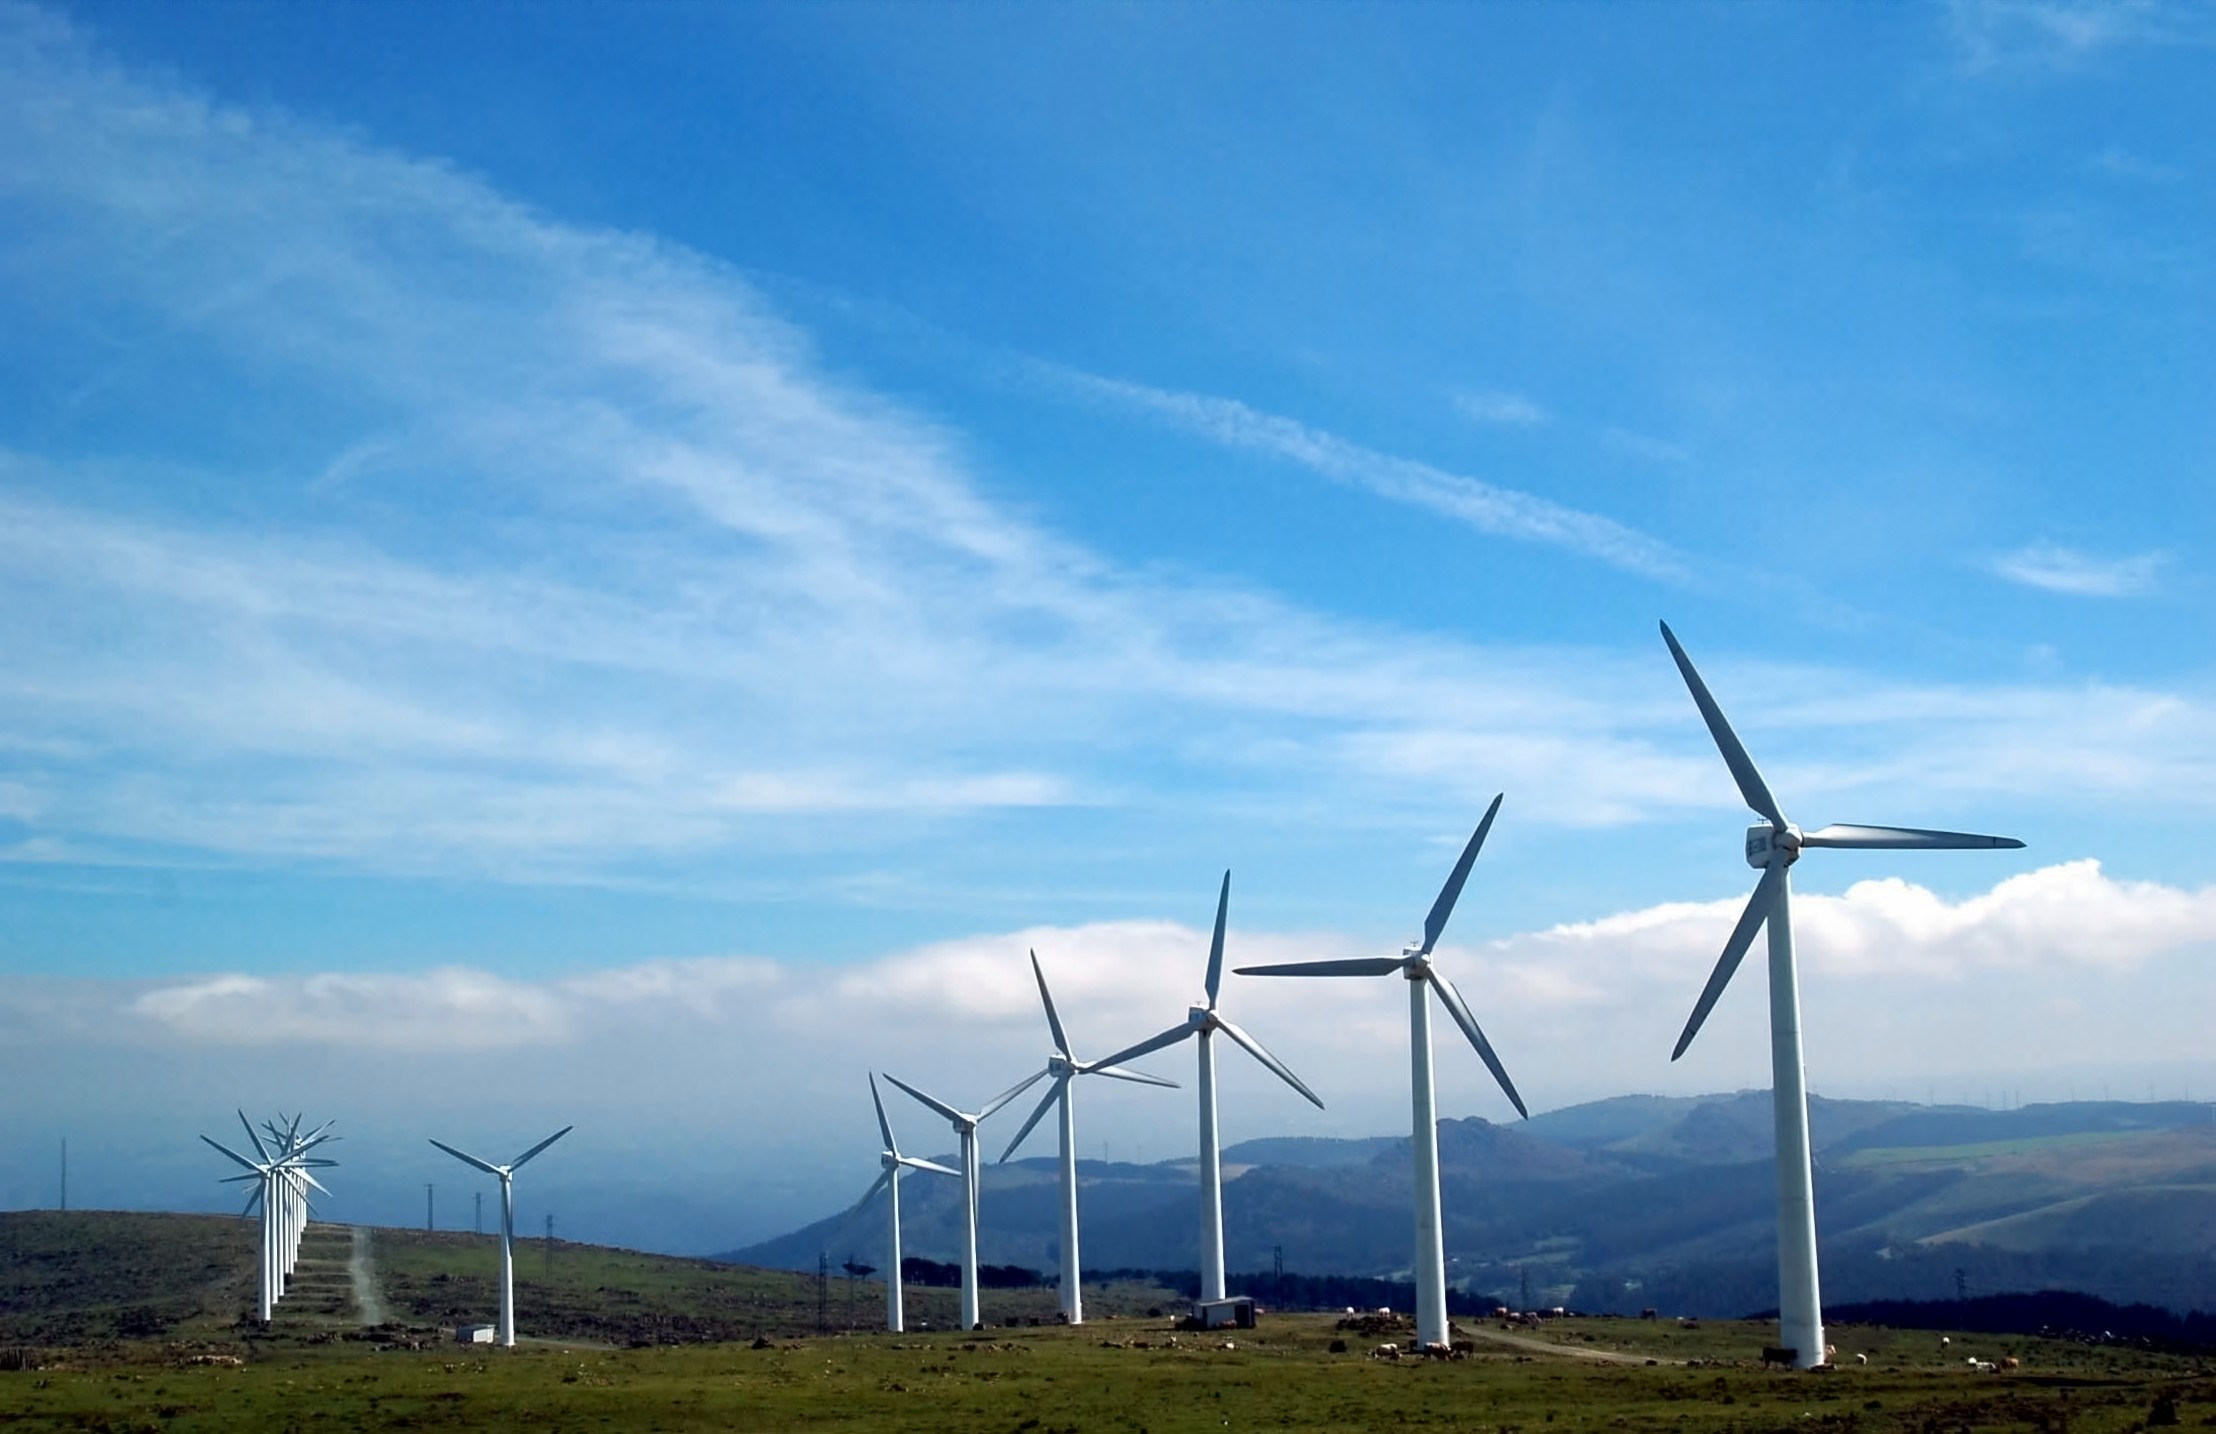
As mentioned in earlier articles, we take an off-shore wind turbine in the North Sea and a solar farm in central Spain as examples for our analyses, both with an 8MW capacity.
Use of reanalysis
There are thousands of weather stations around the globe, but of course they do not exist at every single spot. Also, not all historical hourly data are easily accessible. In order to know the weather conditions at any given location, one solution is simulated weather data, also known as reanalysis data. For example, they are delivered as a commercial service by Meteoblue[3]. They are derived from re-running weather forecast models for the past, but correcting them to the actually observed weather conditions at nearby weather stations.
Simulated wind data from the Dutch Offshore Wind Atlas (DOWA)[4] are what we use for the turbine analysis. It has a very high resolution of grid points of 2.5 by 2.5 km, for different altitudes. At the time of writing, the period covered is from 2008 to 2017. The selected grid point is not too far away from the Dutch coast, northwest of the island Texel (latitude 53.20, longitude 4.44) and at 60 meters height.
Solar radiation explained
Source: PVGIS documentation
“The solar radiation that reaches the top of the atmosphere on a perpendicular plane to the rays, known as solar constant, has an average value of 1361-1362 W/m2 which varies somewhat depending on the position of the Earth in its elliptical orbit.
As the solar radiation goes through the atmosphere it suffers different processes of absorption, dispersion or scattering that result in lower levels of solar radiation being received at the Earth’s surface. These are due to the atmosphere components, such as ozone or CO2, and solid and liquid particles in suspension like aerosols or water vapor. However, the main source of attenuation is the cloud cover. Not only the broadband value is different, but also these processes of absorption and attenuation affect differently the wavelengths of solar radiation, so the spectral distribution of the solar radiation at ground level differs from the extra-terrestrial one.
The solar radiation received at ground level, known as global radiation is the sum of three components. The first one, named beam or direct radiation, is the fraction of the solar radiation that reaches the ground without being attenuated by the atmosphere and can be modelled as coming directly from the solar disc. The second part or diffuse is the solar radiation that reaches the ground after being reflected or scattered by the atmosphere and is considered to arrive from the whole sky dome. The third component, not always taken into account, is the reflected radiation from the ground surface or nearby obstacles. The beam component is only available when the solar disc is not blocked by clouds, while the diffuse component is always available, being the only radiation available whenever clouds block the solar disc.”
“Irradiance is the solar power falling into a surface per unit area and unit time. It is therefore expressed in W/m2. While irradiation is the amount of solar energy received per unit area during a period of time, therefore energy, and it is expressed in Wh/m2.”
Satellite data
Another widely used solution, especially for solar, is satellite data. A great open source is the Photovoltaic Geographical Information System (PVGIS[5]), which is part of the Joint Research Center of the European Commission. For many locations in the world, it publishes hourly irradiation data estimated from satellite observations. In areas where the satellite data are not available (e.g. the Nordics), it is complemented with reanalysis data. At the time of writing the database covers the years 2005 to 2016. The satellite data from PVGIS are the source for our solar analysis. The selected location is near Cordoba, in the south of Spain (latitude 37.78, longitude -4.89).
What is impacting the output of a solar and wind park?
Solar
For solar, we directly use the PVGIS estimated output of a typical solar park in Spain with 8 MW peak capacity in our analysis, instead of transforming the radiation data (as explained in the textbox) to an estimate of power output using a power curve, The advantage is that the data already takes into account the transformation of the three different forms of irradiance into power, and also incorporate the effect of ambient temperature on efficiency. We assume that the solar panel is installed at a slope and azimuth (orientation) which maximizes the annual production.
Note that the optimal total power production may not coincide with the maximum total revenues. A more vertical position increases production in the winter at the expense of the summer, but with higher winter power prices this may financially pay off. This is an important consideration for developers, especially when solar penetration levels increase further and cannibalisation is likely to be most prominent in the summer. Even better is it to have a rotating axis, ideally both vertically and horizontally. According to PVGIS, the average output is 1.5 MW without rotation, while it is 2.07 MW with a double-rotating system, a difference of 38%. Of course, a double-rotating system is more costly to develop and to maintain. Without good insight into what these costs actually are, in the remainder we therefore assume a non-rotating solar system.
Wind
The wind speed data are input in the Sigmoid function of the Vestas 8 MW turbine which we presented in the previous article. The average output from 2005 to 2016 is 3.97 MW, implying an almost 50% load factor. The average solar output is 1.5 MW, so a load factor of 18.8%. Due to maintenance and outages the actual load factors will be a few percentage points lower in practice for wind and maybe 1% for solar.
Production patterns of wind and solar power per year
The following graphs provide a more detailed insight into the yearly, seasonal and intra-daily patterns of the wind and solar power production. Figure 2 shows the average production per year, with more variation for the wind output (5.9% standard deviation) than for solar (3.9%).
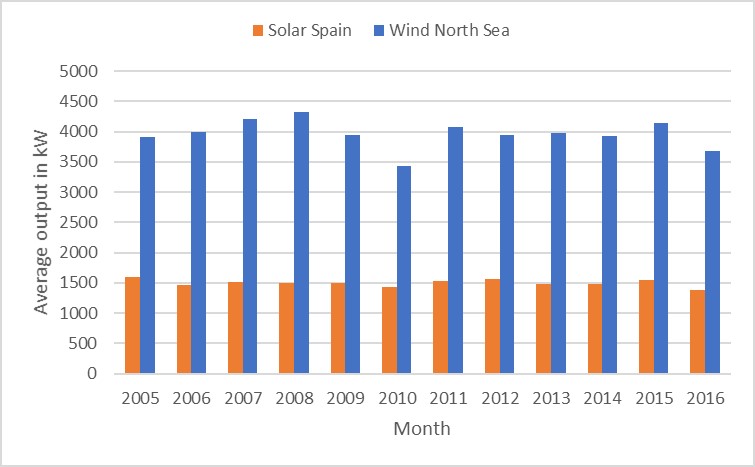
Figure 2: Average output per year of a solar plant in Spain and wind turbine in the North Sea, both with 8 MW maximum capacity, from 2005 till 2016.
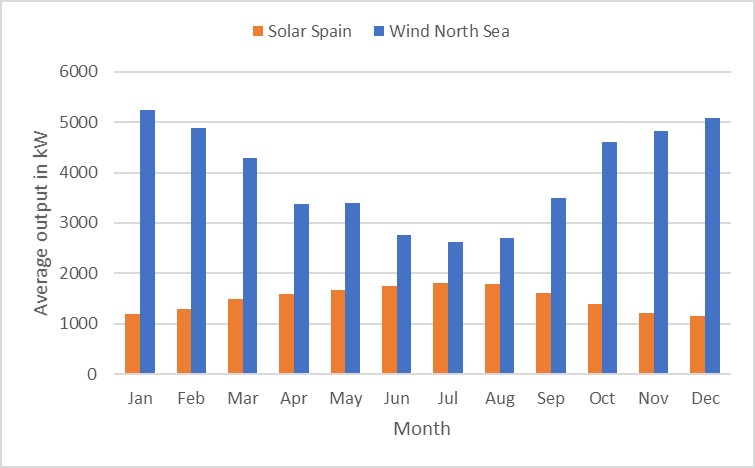
Figure 3: Average output per month of the year, of a solar plant in Spain and wind turbine in the North Sea, both with 8 MW maximum capacity, measured between 2005 and 2016.
Figure 3 shows the seasonal variation for January to December, while figure 4 shows it for each month individually. The highest solar production is in July, while the highest wind production is in January.
Seasonal pattern: wind versus solar
The seasonal pattern of the wind production is almost the mirror image of that of the solar production: a good mix of both types of renewable electricity production will therefore have a stabilizing effect on the electricity system. However, the combined generation is very volatile nonetheless. Per month, the average combined output varies between a minimum of 3385 kW and a maximum of 8244 kW. Per day, the variation is obviously larger, between 186 and 10051 kW. The German language has a nice name for periods with virtually no solar nor wind production: “Dunkelflaute”. It means so much as “dark lull”.
Of course, combining the solar output in Spain with the wind output from the North-Sea is a bit artificial, but the conclusion is generally valid: there is an overall positive stabilizing effect of combining both generation types, but it certainly does not take out all the variation. Hence, other elements in the system must provide flexibility to avoid black-outs: demand response, dispatchable power plants, (pump) hydro facilities, batteries and other forms of energy storage.
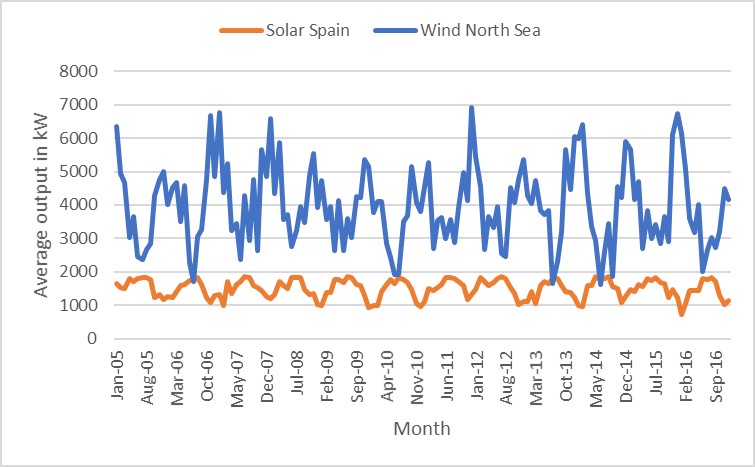
Figure 4: Average output per month of a solar plant in Spain and wind turbine in the North Sea, both with 8 MW maximum capacity, from January 2005 till December 2016.
Production pattern: per day
Finally, figure 5 contains the average pattern during the day. For wind power this is more or less flat. The solar production is not flat at all: zero during the night and peaking between 12:00 and 14:00. Unfortunately, the solar production is very low or even zero at times when the system demand is highest, that is in the early morning (7:00-9:00) and early evening (17:00-19:00). At those times, people turn on the lights, do their cooking, watch television, turn on the heating, etc. For those hours, short-term energy storage such as batteries will be indispensable in the future.
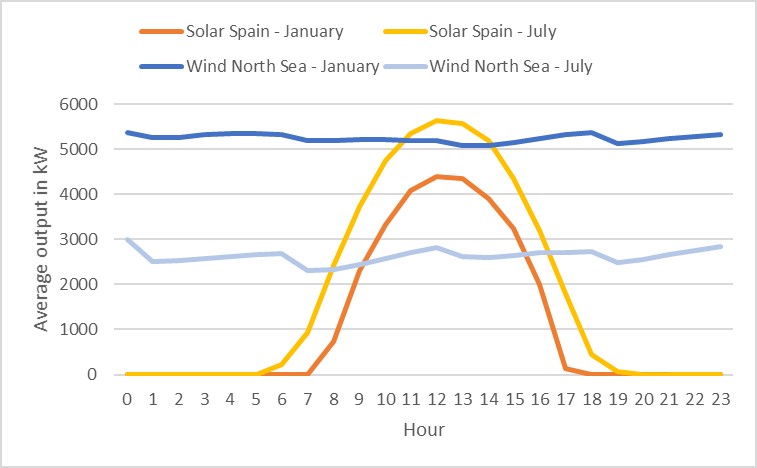
Figure 5: Average output per hour of a solar plant in Spain and wind turbine in the North Sea, both with 8 MW maximum capacity, measured between 2005 and 2016.
Summary
This article has provided a detailed insight into the sources of weather data, useful for assessing the output of solar and wind generating assets. Importantly, actual historical production data are not a prerequisite. Instead, an investor can rely upon the wealth of weather data that has been collected, simulated or derived from satellites across the globe.
In the next article, we shift attention to the future, and explain how scenarios of future production can be generated using either Monte Carlo simulation, or by sampling from the historical data. Such production scenarios are an important building block for the valuation and risk assessment of renewable investments and PPA contracts.
Feedback on our “Financials of renewable Power and PPAs”
We write the articles to share our knowledge and hope it provides a useful source of information for newcomers and experienced professionals alike. Each article will be a mix of qualitative description, some mathematical formulations and numerical examples. Whether you are buying electricity for your company, developing new projects, working for a utility, providing financing, drafting policies, or just generally interested: we hope you read the articles with interest and share your feedback with us: info@kyos.com.
To download this article in pdf: Solar radiation and wind speed data – the financials of renewable power and PPA contracts
[3] www.meteoblue.com. The location Basel is available for free for demonstration purposes. Data of other locations are available at a cost.
[4] www.dutchoffshorewindatlas.nl
[5] https://ec.europa.eu/jrc/en/pvgis