Optimal hedging of a gas supply portfolio – lessons from a warm winter
The exceptionally warm winter in combination with low gas prices has hit many supply companies hard. They expected a safe profit, but incurred losses instead. How could this happen and can it be avoided in the future? In this article we explore the effectiveness of different hedging strategies for a retail gas portfolio. What would have been the optimal hedging in this case?
What are the optimal volumes to hedge in the forward market and what other instruments can reduce risks further? Should companies use gas options, weather derivatives or other exotic products?
Retail demand is temperature dependent
A warm winter reduces retail gas demand, because most of the gas is used for heating. We could use temperature to measure this, but it is more precise to use the so-called “effective temperature”, which also takes into account windspeed, solar radiation or other factors. For this analysis we take the following, widely used, definition for the effective temperature (veff):
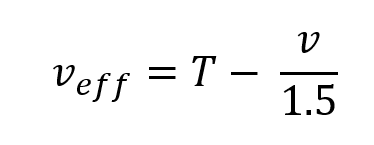
Where T is the average daily temperature in centigrade and v the average daily windspeed in m/s.
The relation between effective temperature and gas demand generally follows the following pattern: for higher temperatures, the gas demand is driven by heating tap water and is independent of the temperature. For lower temperatures heating becomes progressively more important. At very low temperatures the gas demand stabilizes. This temperature dependency of the gas demand can be described as a Sigmoid (inverted S-shape) function or more simply by a straight line between a minimum and a maximum, as shown in the graph. For the sake of simplicity, in this article we assume the linear relation.
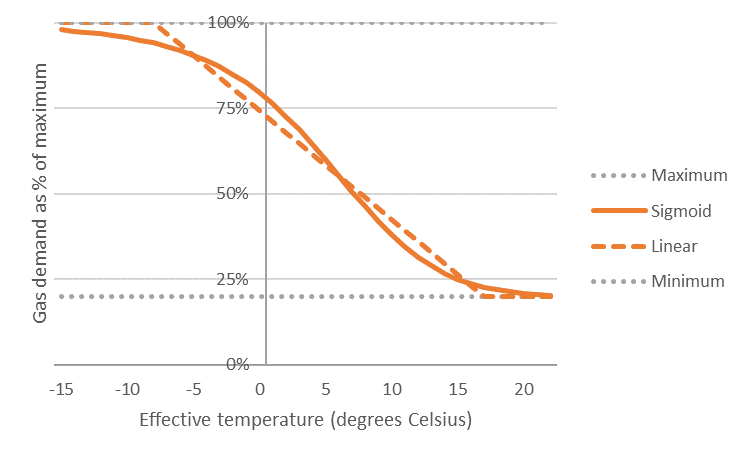
Figure 1: Typical relationship between effective temperature and retail gas demand, modelled with a (piece-wise) linear function or a sigmoid function.
And gas prices are temperature dependent
The reduction in retail gas demand (due to high temperatures) generally leads to lower gas spot prices. For risk management this sensitivity of spot prices to gas demand is quite relevant, as can be seen in the following P&L diagram of a 100% hedged supply company.
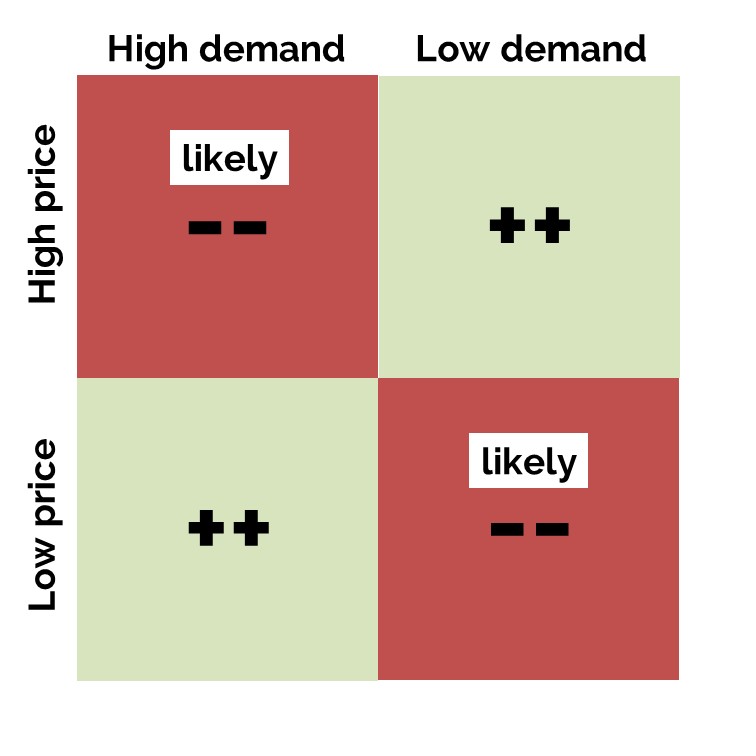
If the demand is high, the company buys extra gas in the spot market. This is profitable if the spot prices are low (lower-left corner), but unprofitable if the spot prices are high (upper-left corner). Likewise, if demand is low, the company is well off when prices are high, because it can sell the excess volumes at a high price in the spot market (upper-right corner), and it is not well of if prices are low (lower-right corner). Unfortunately for the gas supply company, the negative scenarios are more likely than the positive scenarios, because of the negative correlation between price and demand.
Simple supply-demand economics dictate that this correlation certainly exists, but unfortunately it is hard to measure, because there are also many other variables which drive prices. Think of oil prices, pipeline bottlenecks, gas storage levels, developments in the power sector, the global LNG supply situation and economic growth.
As a base case, we assume a so-called effective price of 102%. This means that buying the gas demand at spot prices, on average, is 2% more expensive than the (equally weighted) average spot price. A simple example: suppose that there are two potential scenarios, equally likely: 1) price = 22, volume = 110, and 2) price = 16, volume = 90. The average sourcing cost is (24 x 110 + 16 x 90)/200 = 20.40 €/MWh. This is 2% above the average spot price of 20 €/MWh. The reason for the extra cost is that you need to buy more when the prices are high and less when prices are low. The price of 20 is the equally weighted average, while 20.40 is an unequally weighted average.
Overhedging or underhedging the expected volume?
We will look at a hypothetical Dutch retail supplier and how the mild first quarter of 2020 influenced its results when using different sourcing and hedging strategies. The focus is on the baseload volume, so balancing or structuring costs are not taken into account. Furthermore, any margins or cost mark-ups are assumed to be zero.
The situation is the following:
- Portfolio of 600,000 retail customers, with an expected demand of 4 TWh in Q1-20, based on the average temperature in the past 20 years (2.15°C). Every increase by 1°C in average temperature reduces the gas demand in Q1-20 by 200 GWh. This is a temperature sensitivity of 5%.
- Customers have fixed their prices at the average Q1-20 forward price between 1 January 2019 and 31 December 2019 (see price graph). This average is 19.21 €/MWh.
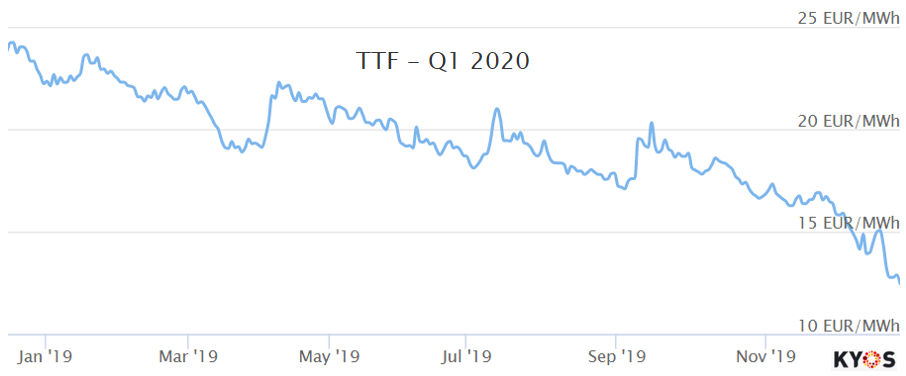
Figure 2: TTF forward prices in 2019 for the Q1 2020 delivery period.
With hindsight, knowing the low spot prices in Q1-20 of 9.54 €/MWh, the most profitable strategy would have been to buy everything in the spot market. However, this would be pure speculation and no sensible supply company will take such a risk. In a different scenario, the company would quickly have gone bust. Instead, sensible forward hedge strategies would gradually buy forward volumes in the market, following the development (price fixing) of the clients. First we analyse four different forward hedging strategies:
- Volume-neutral hedging: buy 100% of the expected volume.
- Underhedging: buy 90% of the expected volume. This would be enough in a warm winter scenario of +2°C above the mean.
- Overhedging: buy 110% of the expected volume. This would be enough in a cold winter scenario of -2°C below the mean.
- Value-neutral hedging: buy 102% of the expected volume (explained in the next section).
Effectiveness of the hedging strategies
For a risk assessment we position ourselves at the beginning of 2019, on the 4th of January. On that date, the TTF forward price for Q1-20 is 22.34 €/MWh. With a 102% effective price, the average sourcing cost is 2% above the current forward price. The value-neutral hedging takes into account that the expected effective price is 2% above the current forward price. Therefore, a value-neutral hedger buys 2% more volume than he plans to deliver, so to equalize the value of his forward position to the value of his expected sourcing cost.
In order to assess the different risk profiles of the hedging strategies, using the KySim Monte Carlo model, we generate 1,000 possible scenarios of gas forward and spot prices, effective temperature and gas demand. The Q1-20 forward price is simulated from 4 January 2019 till 30 December 2019 to calculate the average sales and hedge price. The spot prices, temperature and volumes are simulated until the end of Q1-20. Among many things, the model makes sure that the average Q1-20 forward price and the average realized spot price equal 22.34 €/MWh: this ensures that the price simulations are arbitrage-free with the initial forward price. Furthermore, the model ensures that prices are negatively correlated with the temperature in such a way that the effective price is 102%: when temperatures are low, volumes and prices tend to be high and vice versa. This leads to the following earnings distributions.
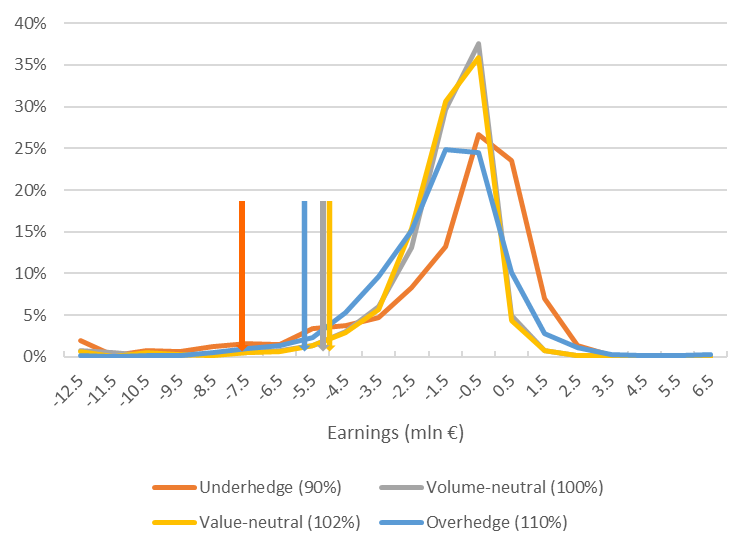
Figure 3: Earnings distributions of four different hedge strategies. The results are derived using the KySim Monte Carlo simulation model for forward prices, spot prices, temperatures and retail gas demand.
The average earnings of each strategy is -1.7 mln €, which is below 0 due to the negative correlation between price and volume. In practice, this is compensated for by a mark-up on the sales prices. The volume-neutral and value-neutral hedge most likely end up in the range of -4 to +1 mln €, but the overhedge and underhedge strategies have more extreme outcomes. The downside risk can be measured as the 95% Earnings-at-Risk (EaR). The four arrows indicate the position of this 95% EaR: 5% of the earnings are below, while 95% are above.
The volume- and value hedge are very close, with the value hedge (-4.7 mln €) performing marginally better than the volume hedge (-4.8 mln €). The overhedge strategy follows just behind (-5.3 mln €), while the underhedge strategy performs clearly worse (-7.8 mln €). The high risk in the underhedge strategy comes from the scenarios which may be labelled “cold winter”, where volumes and prices are high. The price distribution is right-skewed, meaning that a high spot price is potentially more extreme (100 €/MWh or more) than low prices (in exceptional cases 0 €/MWh). The overall effect is that a supply company should really not be short in such a situation.
Reducing price exposure is quite well possible for this gas supplier, and the 100% (volume) or even better the 102% (value) hedge strategies are most effective. The main risk that remains is a temperature-price related risk. This can be split into a volume part (long/short position due to different temperatures than expected) and a price part (sourcing the long/short position at spot prices). In the next section study the actual situation in Q1-20, in which the volumes and prices turned out to be highly correlated.
Profits and losses in Q1-20
The weather in the first quarter of 2020 was mild. In the graph, the grey-shaded area gives the range of daily effective temperatures over the last 20 years in the first quarter of the year. The black line is the daily average, while the red line is the 2020 temperature. Especially the first half of Q1-2020 was mild, and brought the average to a level of 3.59°C, which is 1.52°C higher than normal. This had a strong effect on (retail) gas demand as well as on wholesale gas prices. TTF spot prices went to levels not seen since 2009, averaging 9.54 €/MWh. It has to be mentioned that not only the mild winter conditions in Europe were responsible. It was also due to a strong supply of LNG to Europe, partly caused by the COVID-19 effect on Chinese gas demand.
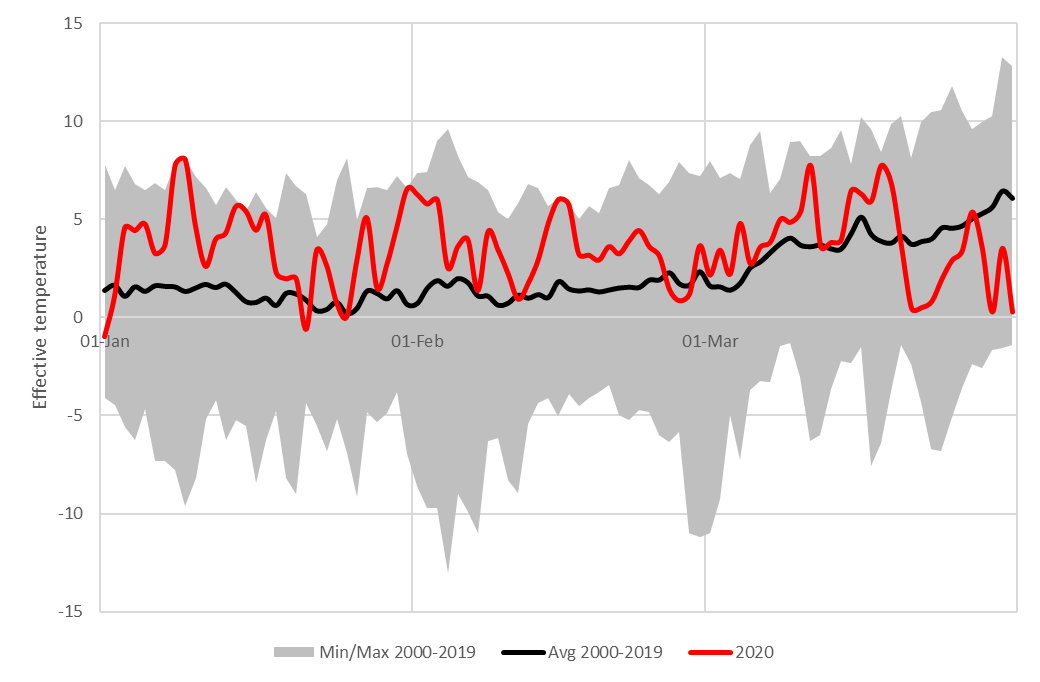
Figure 4: Effective temperature (degrees Celsius) in the Netherlands in the first quarter of the year.
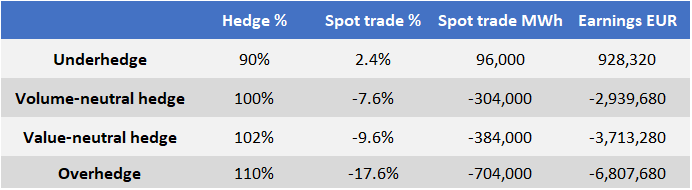
How did the different hedging strategies materialize during Q1-2020? We investigate the 90, 100 and 110% hedges. As a result of the mild temperatures, and the 5% temperature sensitivity, the gas demand was 1.52 x 5% = 7.6% (304 GWh) lower than expected. Due to the low spot prices, underhedging was beneficial this year: with 90% of the expected volume hedged, and 92.4% actually needed, the remaining 2.4% could be bought at a low spot price. Because the customers pay a price of 19.21, this yields extra earnings of 2.4% x (19.21 – 9.54) x 4 mln = 0.9 mln €. The other two strategies generated a loss: around 2.9 mln for the 100% strategy and 6.8 mln for the 110% strategy.
 In all hedging strategies the expected earnings at the start of the quarter was -1.7 mln €. Although the actual earnings were quite different, they do fall within the ranges of the Monte Carlo distributions. In this particular situation, the 10% underhedge was the lucky winner, the only one ending in the plus. In a contrary scenario, however, its losses can well exceed the 7 million €, which is sizable compared to the total sales value of around 77 million.
Effective enough?
Both the simulation exercise and the actual Q1-20 results show the materiality of the exposure that exists in a retail portfolio. A large part of the exposure can be hedged with forward products. In general, it is important not to be underhedged, but aim for 100% or even slightly more. This requires good expectations of the sales volumes and discipline among the portfolio management department. If a supplier wishes to reduce the remaining exposure, it’s possible with structured products. This includes gas options and weather derivates. The structure, pricing and effectiveness of such products deserves a separate analysis, which will be published in a forthcoming article.
To download this article as pdf: Optimal hedging of a gas portfolio – lessons from a warm winter