PPA Insights: Short-term forecasting and imbalance costs
The financials of renewable power and PPA contracts
Author: Dr Cyriel de Jong, KYOS Energy Analytics, Dr Sonja Kovaleva, Energy Essentials
Short-term forecasting and imbalance costs
 This article dives into the topic of short-term forecasting and balancing in power markets. Our primary concern is the imbalance costs of renewable generation assets due to the intermittent nature of renewables. As a result of this, the actual production is different from the day-ahead forecasted production as sent to the transmission system operator. However, we use this article also to explain short-term power markets and balancing mechanisms in more detail. In a follow-up article we discuss the benefits of energy storage, especially from batteries, to reduce balancing costs and make additional profits.
Balancing cost component in
the PPA value
The largest value driver of a PPA is the baseload power price. Unfortunately, a renewable generation asset does not produce baseload, and this leads to the shaping and balancing costs. The shaping cost is not a directly observable cost, but rather the difference between the baseload price and the realized (or effective) price in the day-ahead spot market. The second cost component, balancing cost, results from the intermittent nature of solar and especially from wind: their production cannot be forecasted day-ahead with full accuracy. Most of the time, those imbalances will be correlated with the system imbalances, and therefore constitute a system cost, which the contributor pays for in the form of imbalance prices.
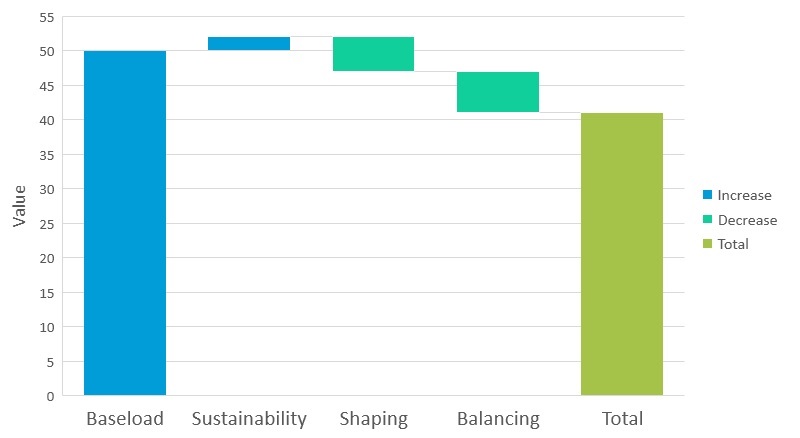
Figure 1: Value components of renewable power and physical PPA contracts.
What is spot power trading?
In order to understand imbalance costs, it is good to briefly review the workings of power markets, especially the very short-term part of it. Spot power trading is generally defined as the trading of power in the wholesale market from day-ahead until just before delivery, gate closure. Day-ahead trading on a central day-ahead auction has traditionally been the main market mechanism for spot power trading. However, in response to the increasing penetration levels of intermittent renewable power generation, such as solar and wind, trading dynamics have moved to shorter horizons than day-ahead.
Between day-ahead and actual production, the weather patterns can still change significantly, thereby changing the output from renewable generation. Being able to adjust trading positions accordingly, has become a key element to short-term balancing the portfolios of the power market operators, and thereby also balancing the system.
Spot trading can be divided into several segments:
- Day-ahead auctions for delivery D+1
- Intraday auctions for delivery D+1 or on the same day D
- Continuous trading for delivery D+1 or on the same day D
- Very short-term balancing trades with the TSO for delivery within the next 60 minutes or so
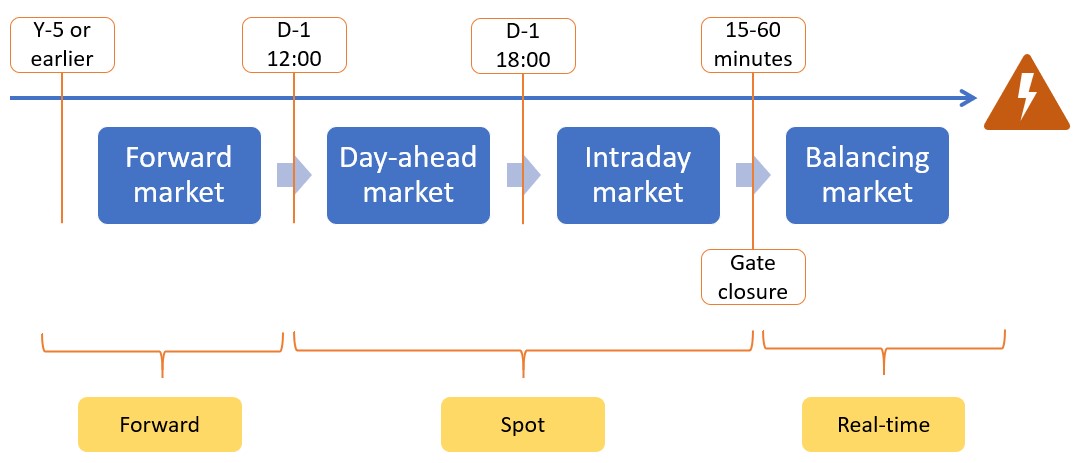
At some point in the afternoon on D-1, balancing responsible parties (BRPs) have to send their expected net consumption or production for the following day D to the transmission system operator (TSO). This is called the e-program. Imbalance volumes are the difference between the volumes in that e-program (per hour) and the actual volumes (per 15 minutes). Depending on the costs for the TSO to smooth out the net imbalance of all BRPs in the system, an imbalance price is determined. Imbalances of all the BRPs are automatically settled by the TSO.
Wind portfolio imbalance volumes
For a Dutch energy market player, we performed a detailed analysis of imbalances in 2020. The company has divided its portfolio in various segments, one of which is the wind generation segment. This consists of a number of turbines at different locations in the Netherlands. The total capacity is 250 MW and the average production 60 MW, i.e. a load factor of 24%.
Each day (D-1) before 1 pm, the company submits its e-program to the Dutch TSO Tennet, containing the expected production or consumption in each hour for the following day (D). It sends in the e-program for the total portfolio, also including retail and industrial consumers, but we will first concentrate on the wind generation portfolio and assume the wind production forecast is a separate e-program. This allows us to isolate the imbalance costs for wind.
The actual production, also called allocation, is measured per Imbalance Settlement Period (ISP) of 15 minutes. On average, the forecasted volume is almost equal to the actual volume, but the forecast is never perfect due to uncertainty about weather conditions. For example, the wind portfolio has an average absolute imbalance equal to around 10 MW, so 16.8% of the average production. Because the e-program is per hour, and actual production can vary per ISP of 15 minutes, some imbalances cannot be avoided with better forecasting techniques. Even with a perfect hourly wind generation forecast, the imbalance would be 4.1% on average.
The development of forecast, actual and imbalance is shown in figure 3 for the first 7 days in January 2020. In the first few days the actual production was lower than expected (negative imbalance volume), while the last day had a reverse pattern (positive imbalance).
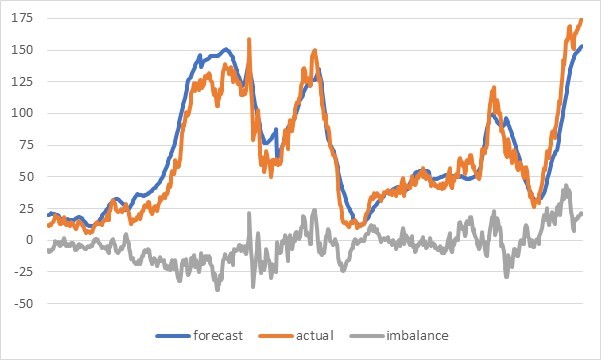
Figure 3: Forecast production, actual production and imbalance volume for a wind power portfolio in the first 7 days of January 2020.
After the actual power flows in the system are known, TSOs can establish the imbalance price for that particular ISP (15-minute period). TSOs follow certain pre-defined rules, which vary per country, but should follow some general rules defined at EU level. For example, imbalance prices should be directly derived from the TSOs costs for restoring the system balance. As much as possible, the price for a positive imbalance is the same as for a negative imbalance. However, in some ISPs the price for positive imbalance is below that of negative imbalance, because in part of the ISP there was a positive system imbalance while in another part it was negative.
In the dataset for 2020 (until 23 November), the Dutch positive and negative imbalance prices differed 8% of the time. The average price on the day-ahead market was 30.34, for negative imbalance 33.75 and for positive imbalance 30.45 €/MWh. This means that the earnings from positive imbalances were slightly higher than the day-ahead prices, but in other years it could very well below the day-ahead price. Furthermore, power operators have the responsibility to have their demand and supply in balance so that overall deviations of the system are minimized. We explain that in more detail in the next section.
We first zoom in on a short period, the 96 quarter-hours (ISPs) on 1 January 2020. See figure 4. The average hourly day-ahead price was 35, and in any hour between 30 and 44 €/MWh. However, the imbalance prices varied between -130 and +450 €/MWh, a much more extreme behavior, quite representative for the whole year. The graph also shows the underlying source for the imbalance prices, which is the net imbalance volume. To ease the visualization, in this graph a positive volume means the system is short, and a negative volume the system is long (it is normally presented the other way round). Time blocks with a large shortage, such as around 6-7 pm, correspond to high imbalance prices. They can quickly be followed by time blocks with excess power and negative imbalance prices, such as around 8-9 pm.
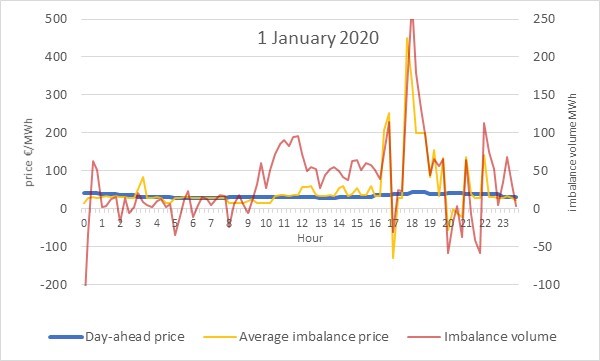
Figure 4: Day-ahead prices, imbalance prices and the net imbalance volume in the Dutch power system on 1 January 2020 (source: TenneT).
Imbalance costs for the wind portfolio
The day-ahead forecast of the wind power generation is obviously imperfect. Sometimes this forecast error leads to an imbalance that is actually quite profitable, for example when the actual production is higher than expected, the overall system is short and the wind power operator receives a high price for the imbalance volume. However, in other time blocks the wind farm’s own imbalance contributes to the system imbalance and earns a disadvantage price: long volumes earn a low or even negative price, while short volumes pay a high imbalance price.
The cost of such imbalances depends on the correlation between the portfolio imbalance and that of the system. The more positive this correlation, the more negative it works out on the earnings of the wind portfolio: for example if the system is short and the wind portfolio produces less than expected, the imbalance is likely to be settled at a high price. This wind portfolio has 18% correlation between its own imbalance and that of the market, which leads to significant imbalance costs. With a perfect forecast, so all volumes perfectly sold on the day-ahead market, the earnings would have been 27.51 €/MWh. The imbalances reduce the earnings by 2.48 to 25.03 €/MWh. This is summarized in table 1.
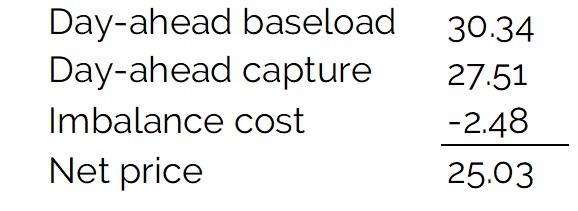
Table 1: Breakdown of net sales price, in €/MWh, of a Dutch wind portfolio in 2020 (1 Jan – 23 Nov).
How to make a renewable generation forecast?
In order to minimize imbalance costs, it is crucial to make the best possible generation forecast. The third and fourth article of this series on renewable power and PPA contracts, covered the topics of weather data and power curves. These are the two primary inputs for a renewable generation forecast. Weather forecasts are available at a range of geographical locations and can be bought from various vendors. Larger companies combine these external forecasts with the insights and models of their own meteorologists and data scientists. Because there is no weather station on every square kilometer of land, let alone on sea, measurements and forecasts from different stations are interpolated and combined with satellite observations to arrive at a narrow grid of 1 to 5 km. These again are interpolated to make wind speed and solar radiation forecasts at the location of the wind turbine or solar farm, also taking into account the height (wind), the orientation and azimuth (solar), the effect of other nearby turbines (wind) and other factors affecting the actual production.
Making a detailed day-ahead forecast per generation asset (or park) and then combining them into a portfolio forecast, is called a bottom-up approach. The portfolio forecast can be the simple sum of the individual forecasts, but it is generally possible to improve on this with statistical or machine learning techniques. The individual forecasts may be seen as information vectors, which can be enhanced with other information and fed into a specific algorithm to minimize the forecast error and hence the imbalance volumes of the overall portfolio.
Mixed demand and solar generation
In this article, we have primarily focused on the wind generation portfolio. Power generation of wind farms, and the wind speeds at the wind farms, are generally well measured and almost instantly available. The same applies to larger solar farms. However, much solar generation is ‘behind-the-meter’, so not separately measured. Many solar panels are on rooftops of individual households or commercial buildings and, unless equipped with smart meters, their generation is never actually known. This poses significant challenges to energy companies and network operators.
A large part of electricity demand is actually a mix of normal demand minus the behind-the-meter solar generation. This mixed demand is therefore influenced by various variables. First of all, the season and the day in the week determine how much electricity we consume for lighting, cooking, electric appliances and in the office. But weather plays a role too, in particular solar radiation and temperature. Obviously, high solar radiation leads to higher solar power generation, so reduces net electricity demand. The impact of temperature is more complex. High temperatures increase demand from air-conditioning in the summer, while in winter it decreases demand for electric heating and heat pumps, and even that of electric vehicles. At the same time, buildings with solar panels will see an increase in net (metered) demand when temperatures due to the decrease in the efficiency of solar panels (assuming the same solar radiation).
The 14th of June 2020 (see figure 5) is a good example of how inaccuracy in the solar radiation forecast creates imbalance in a supply portfolio. On this day, the solar radiation forecast used to predict the energy generation turned out to be much higher than the actual solar radiation on that particular day. Consequently, the net electricity demand turned out to be significantly higher than expected. In many hours, the market overall was quite well in balance, except for a few ISP with short imbalance prices above 150 €/MWh. This created a significant cost in the period between 12:00 and 18:00; the company could have bought day-ahead at 16.55 €/MWh, while the short imbalances costed 72.84 €/MWh on average.
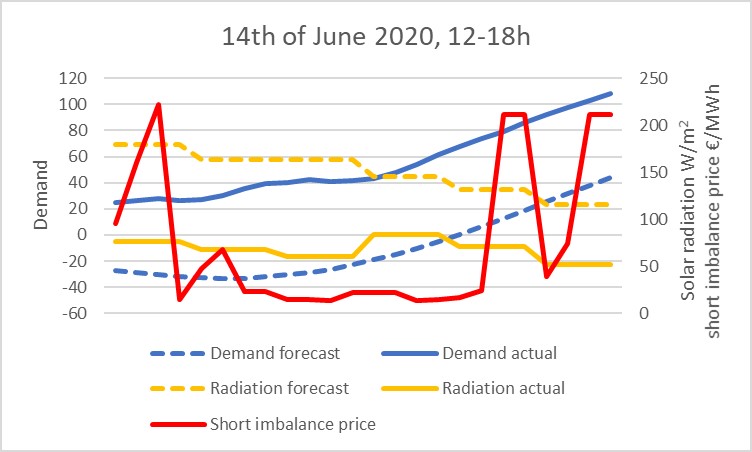
Figure 5: Solar radiation forecasts and net demand in the portfolio of a retail supplier in the Netherlands, together with short imbalance prices in the Dutch power market. Demand has been rescaled in order not to reveal potentially sensitive data. Source: KYOS / Energy Essentials analysis and Tennet.
Managing imbalances
Renewable generation assets like solar and wind have a production which cannot be perfectly forecasted. This leads to imbalance price costs of around 1-5 €/MWh. Imbalance costs can only be partially mitigated with investments in better forecasting software, data scientists and meteorologists. Another way to dampen the effects of imbalances is to have a diversified portfolio. Solar and wind, for example, may have opposite imbalance volumes, because cloudiness often goes together with higher wind speeds. Other forms of diversification, for example geographically, or combining generation with retail demand, can also help to mitigate the risk of imbalances. The ideal form of diversification is actually with flexible assets, the most flexible of which are batteries. Batteries have different sources of revenue and may complement a renewable energy portfolio, as we will investigate in the next article.
Feedback on our “Financials of renewable Power and PPAs”
We write the articles to share our knowledge and hope it provides a useful source of information for newcomers and experienced professionals alike. Each article will be a mix of qualitative description, some mathematical formulations and numerical examples. Whether you are buying electricity for your company, developing new projects, working for a utility, providing financing, drafting policies, or just generally interested: we hope you read the articles with interest and share your feedback with us: info@kyos.com.
To read this article in pdf: Imbalance – the financials of renewable power and PPA contracts